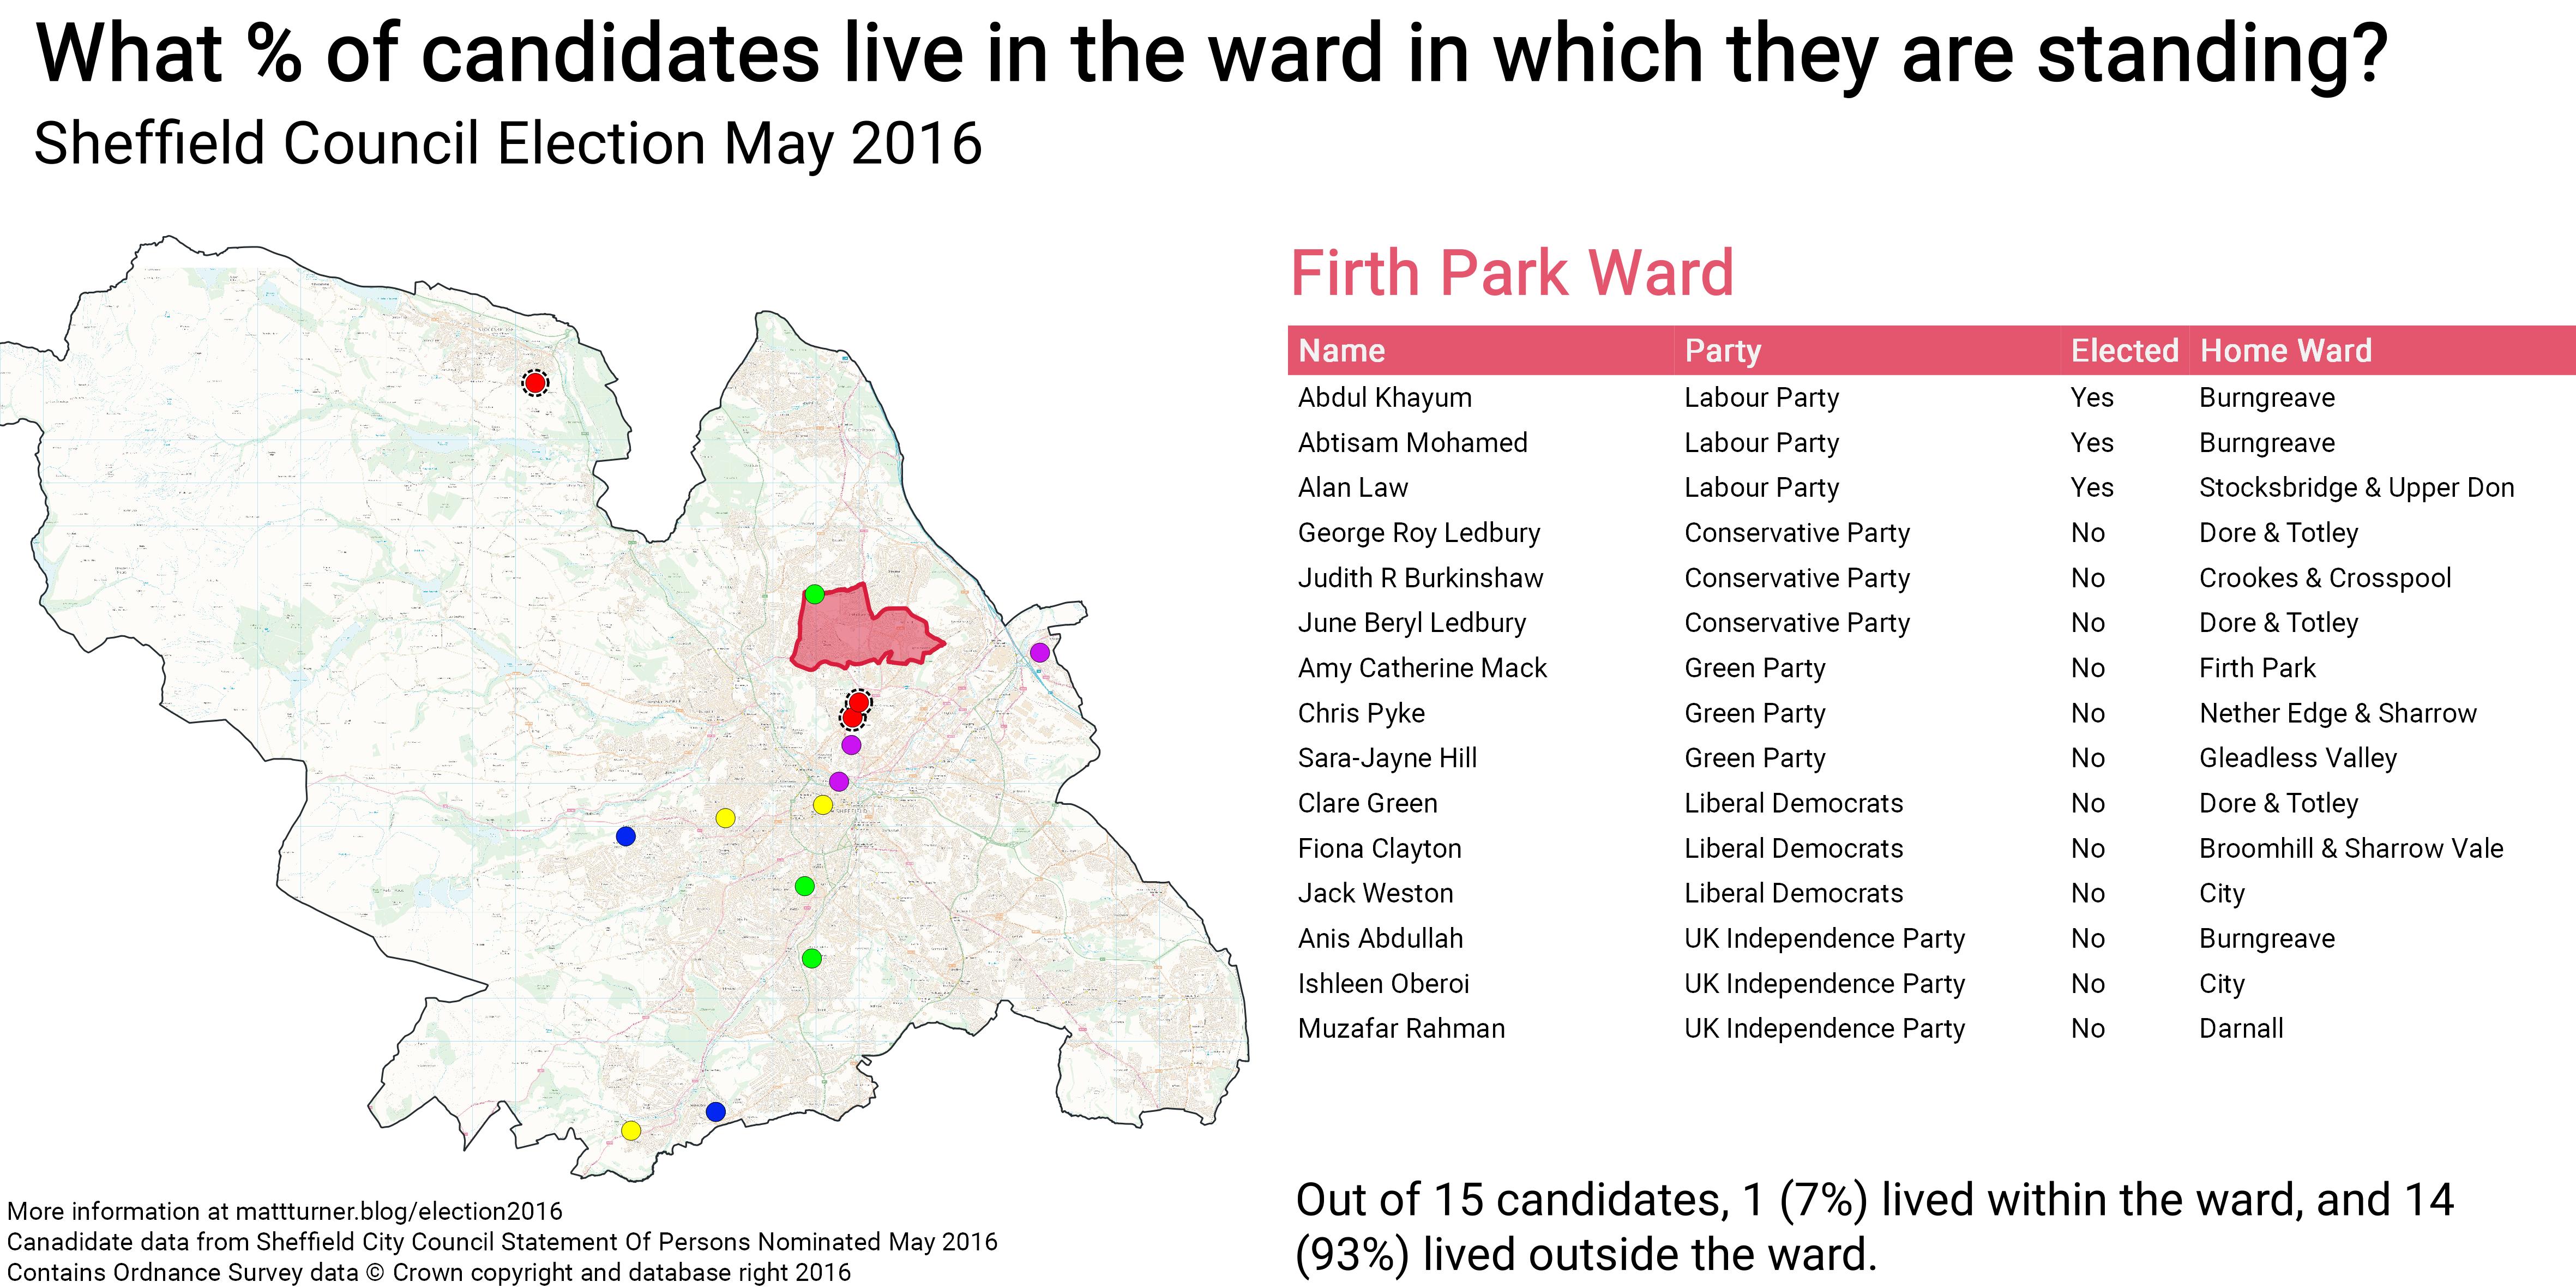
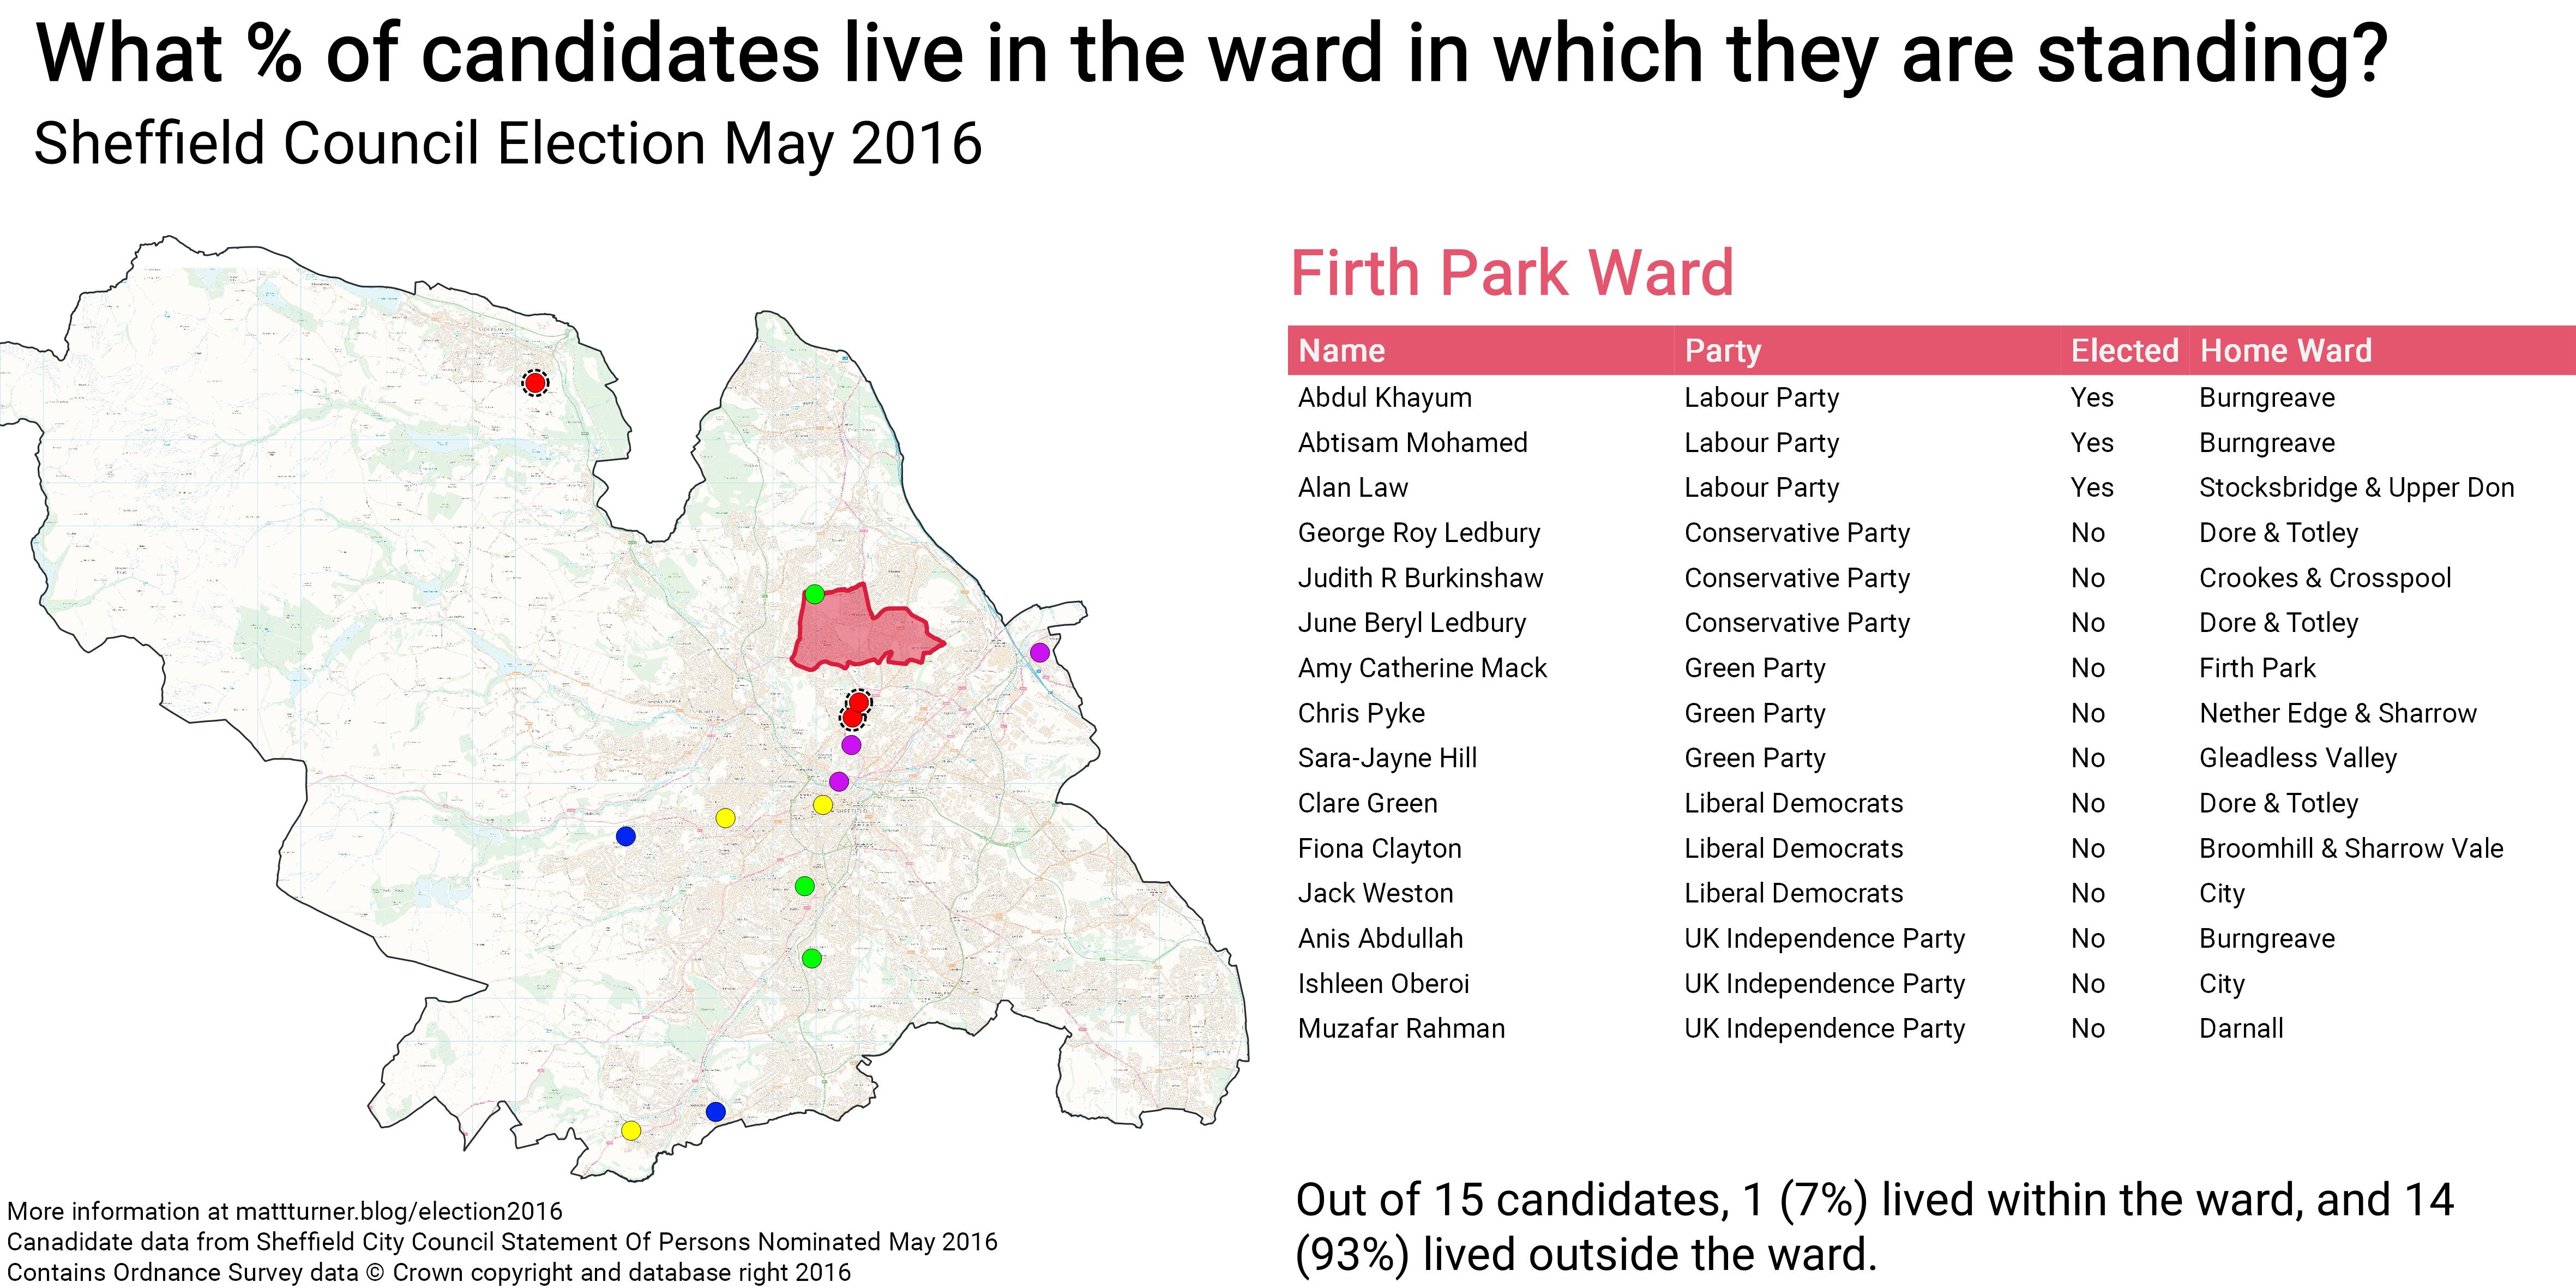
If you’re one of the 21,000 people who live in Firth Park Ward, then in the May 2016 Sheffield Council election, 13 of the 14 candidates you could vote for lived outside your ward.

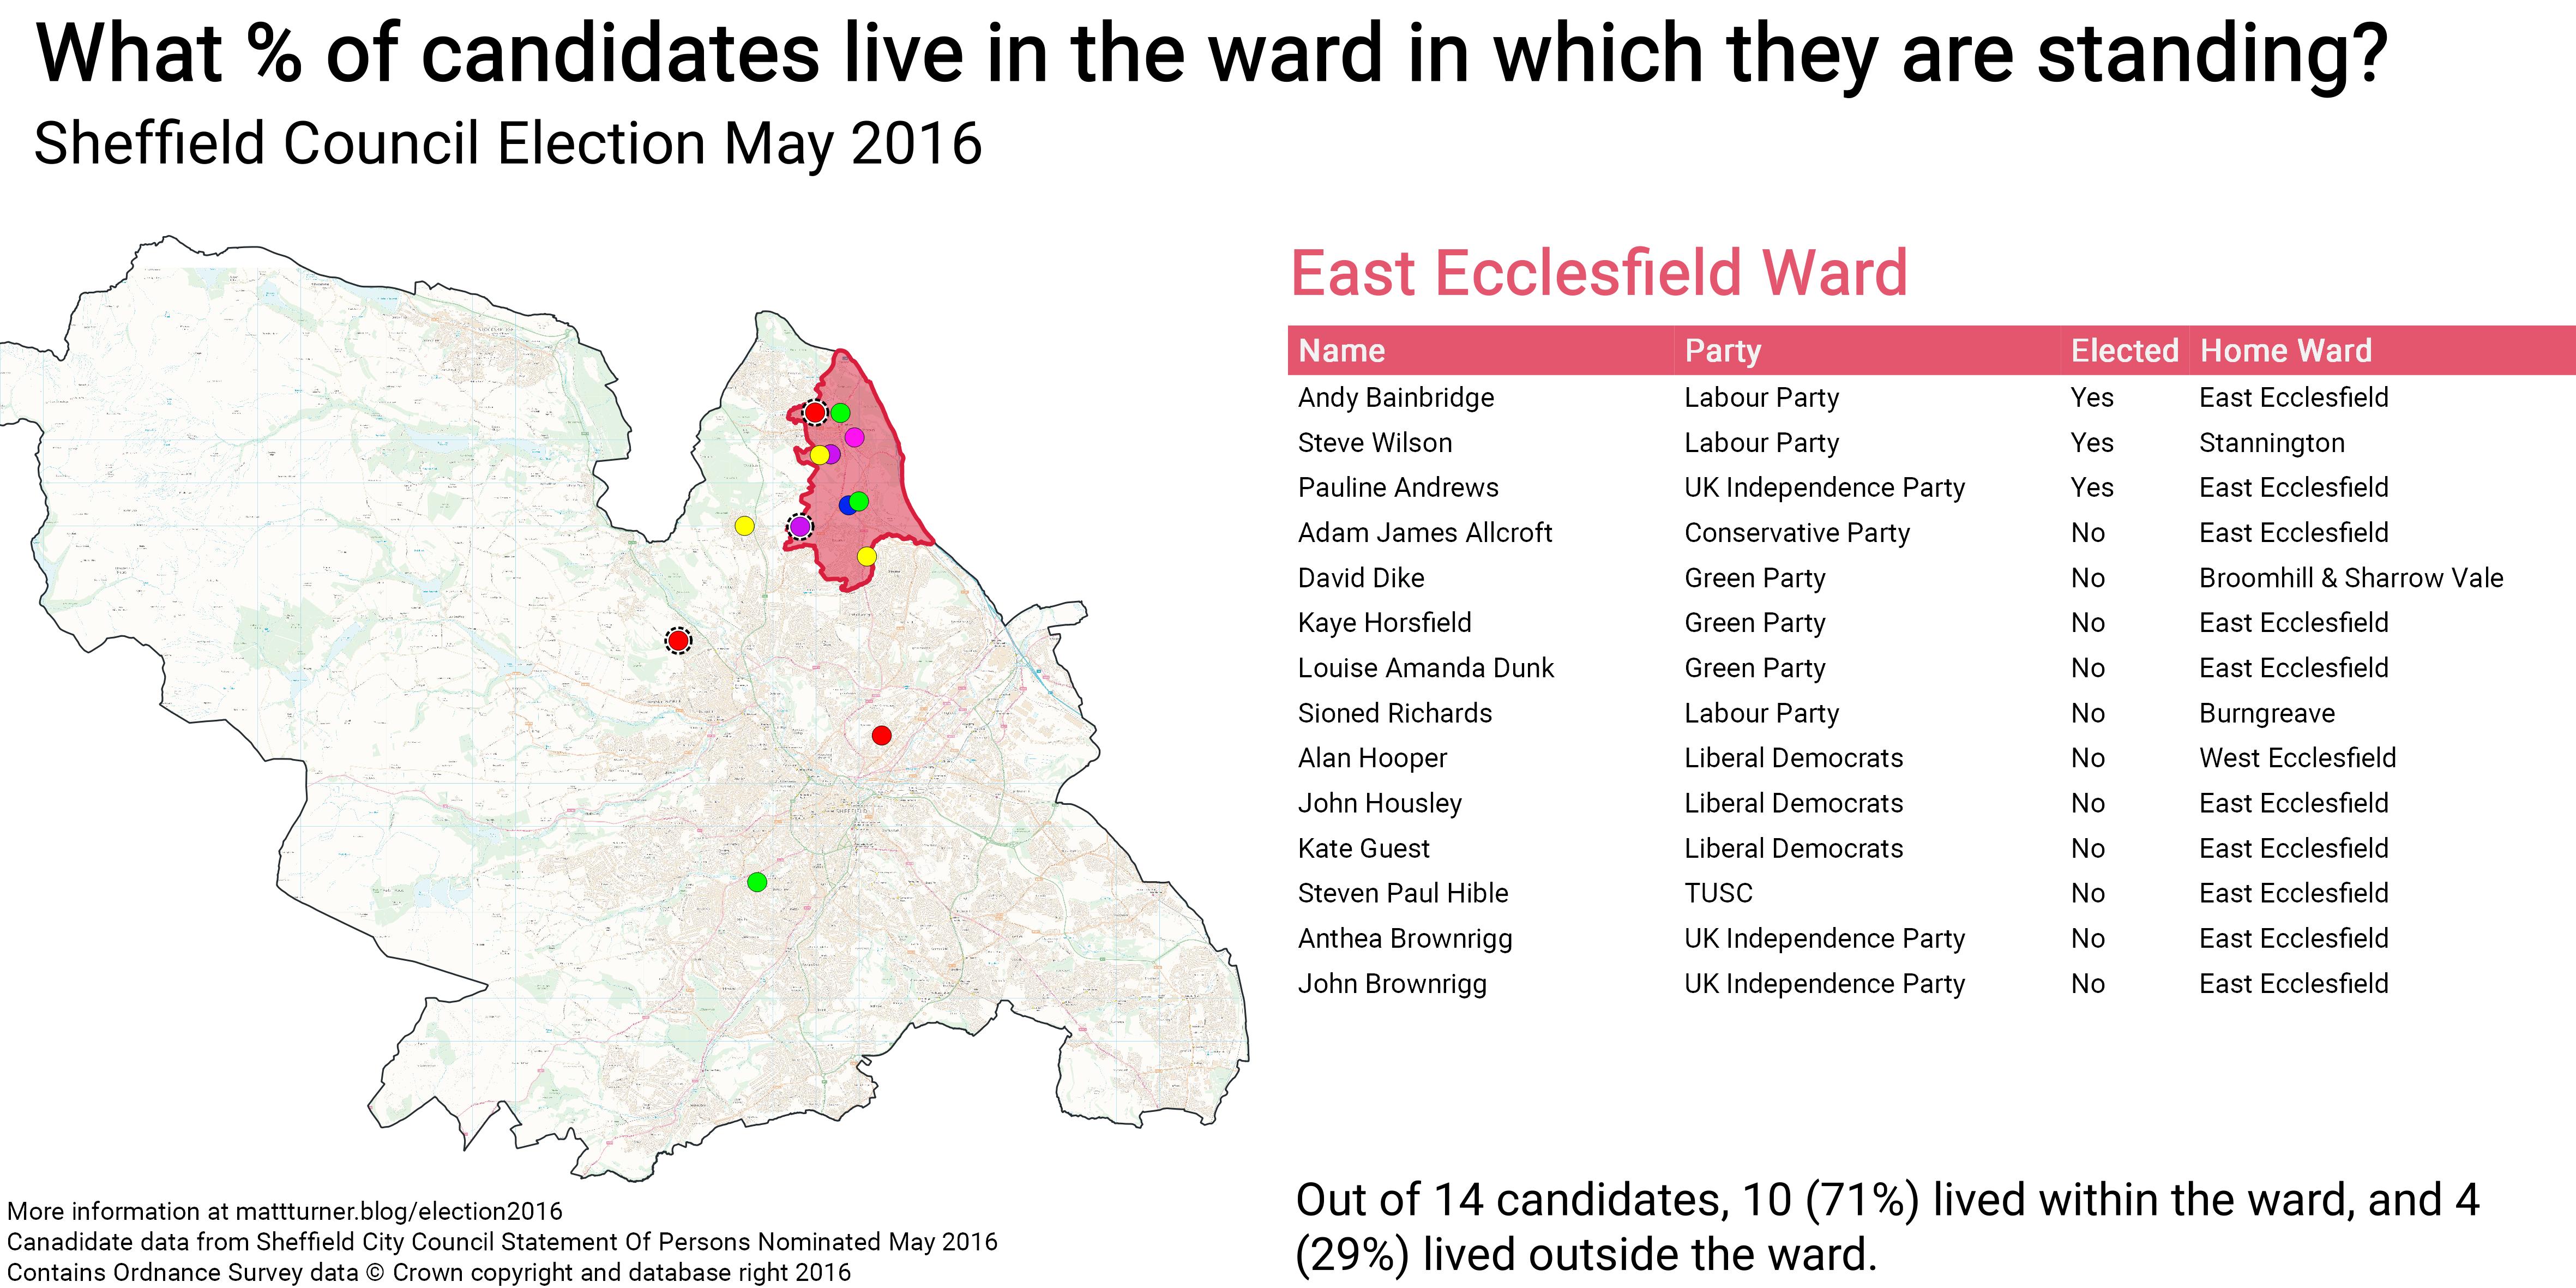
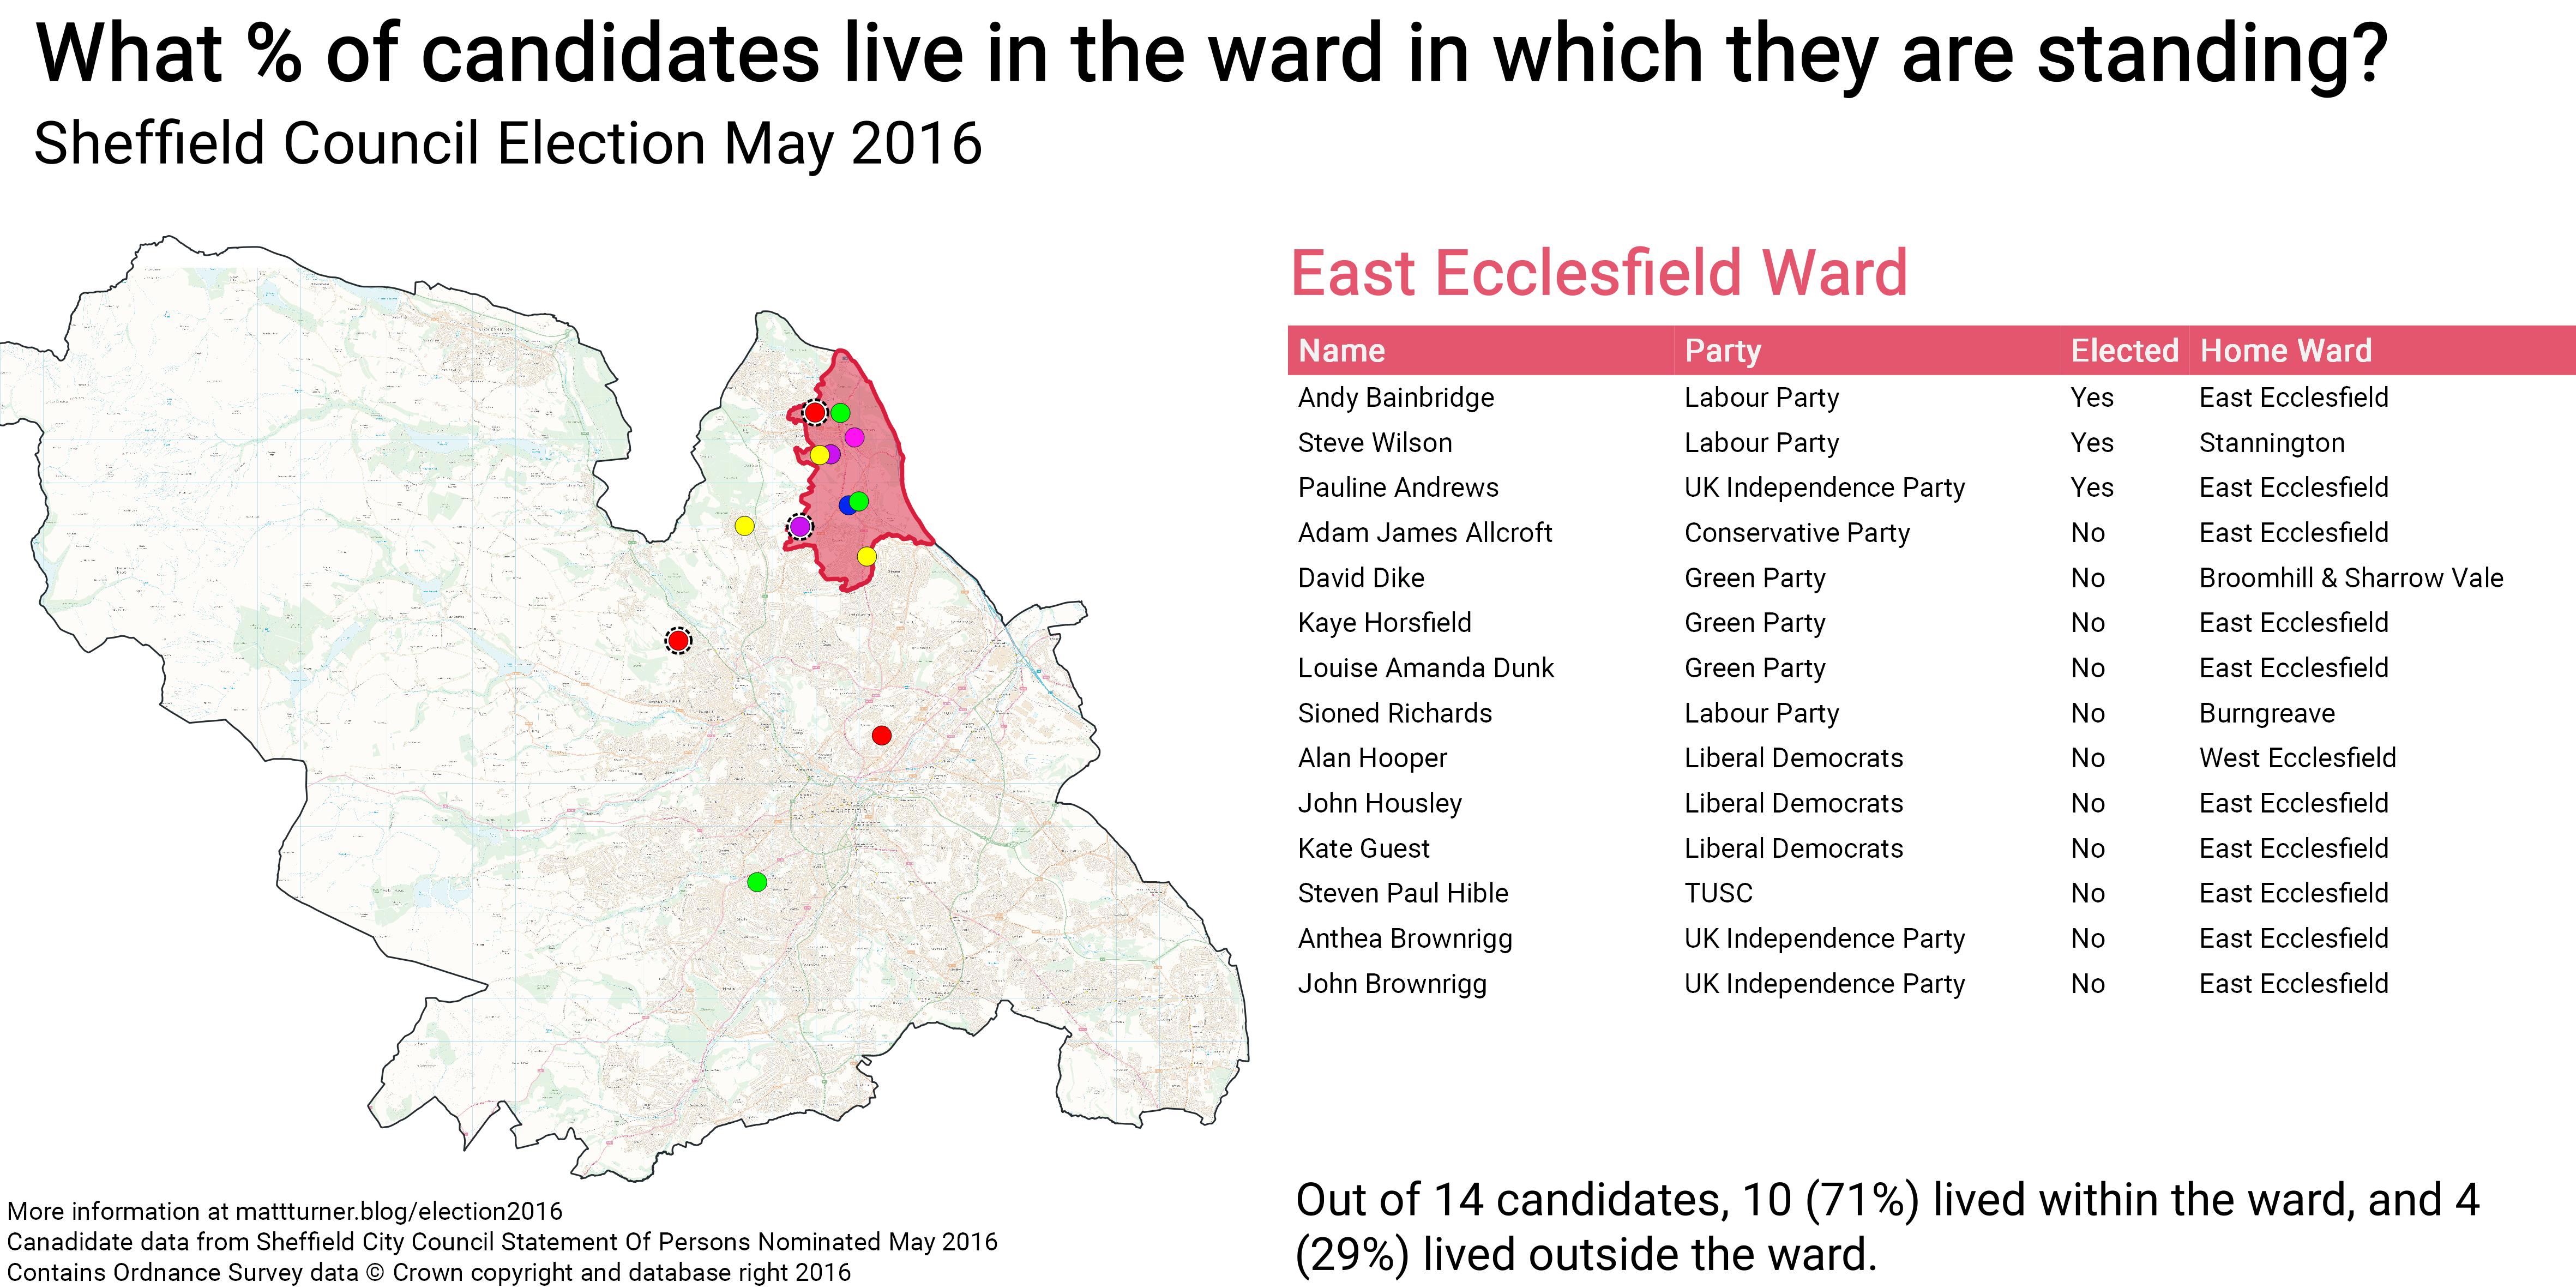
However, in a different part of the city, 71% of East Ecclesfield’s candidates lived within the ward.
 Across Sheffield the picture is varied, of the 372 candidates in 28 wards, 36% lived in the ward in which they were standing, 64% did not.
In this post I’m going to look at the candidates in the 2016 Sheffield Council election and try to explore some interesting information about the people who stand for election as local councillors. I’m not making any judgements about the results of this information, but I do think it’s interesting to see the disparity across different areas of the city and between the political parties.
The data is from the ‘Sheffield City Council Statement of Persons Nominated May 2016’, the maps were created using QGIS, maps for all wards are at the bottom of this post and in this Google Drive folder, I hope to make the source data available online soon.
Some background
Sheffield has 28 wards which were recently changed as part of a boundary review. There are 3 seats per ward, usually one candidate is voted on per year, but in May 2016 there was an ‘all out election’ where 3 people would be elected to each ward in one election.
There were 372 candidates from 8 parties (including independents, however only 1) Conservative53Green84Labour84Lib Dem84Trade Unionist and Socialist23UKIP42Yorkshire First1Independent1
Do councillor candidates live in the wards they’re standing in?
Of the 273 candidates, only 135 (36%) listed their home address as within the ward where they were standing, 237 (65%) lived outside the ward.
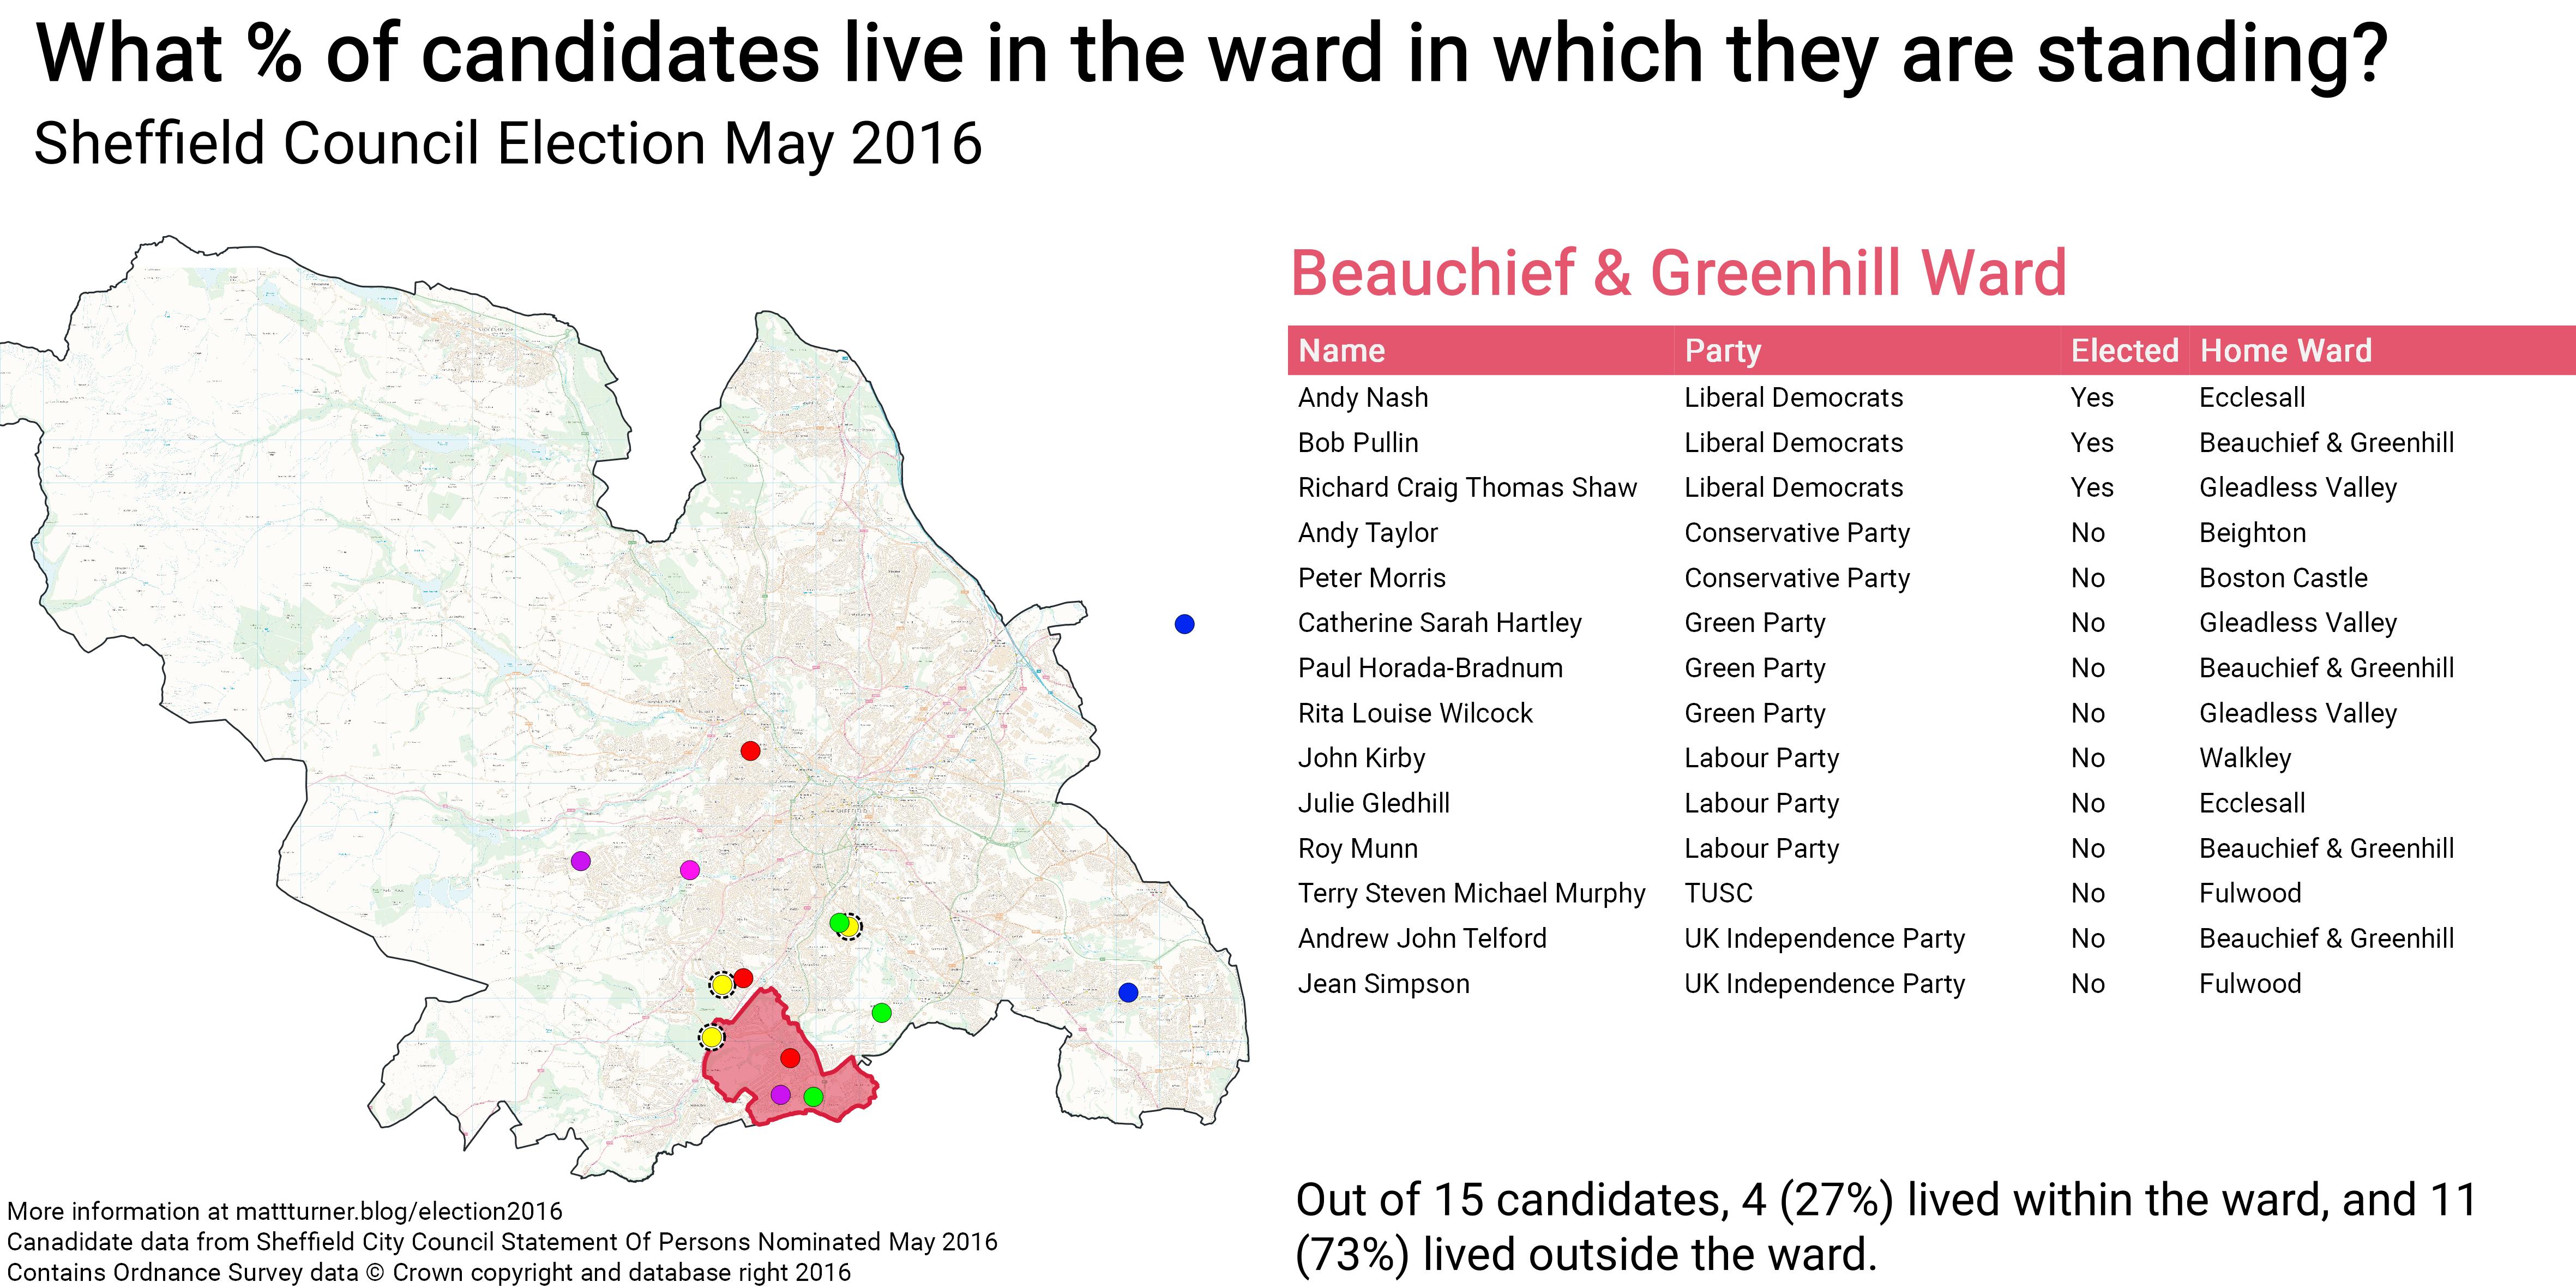
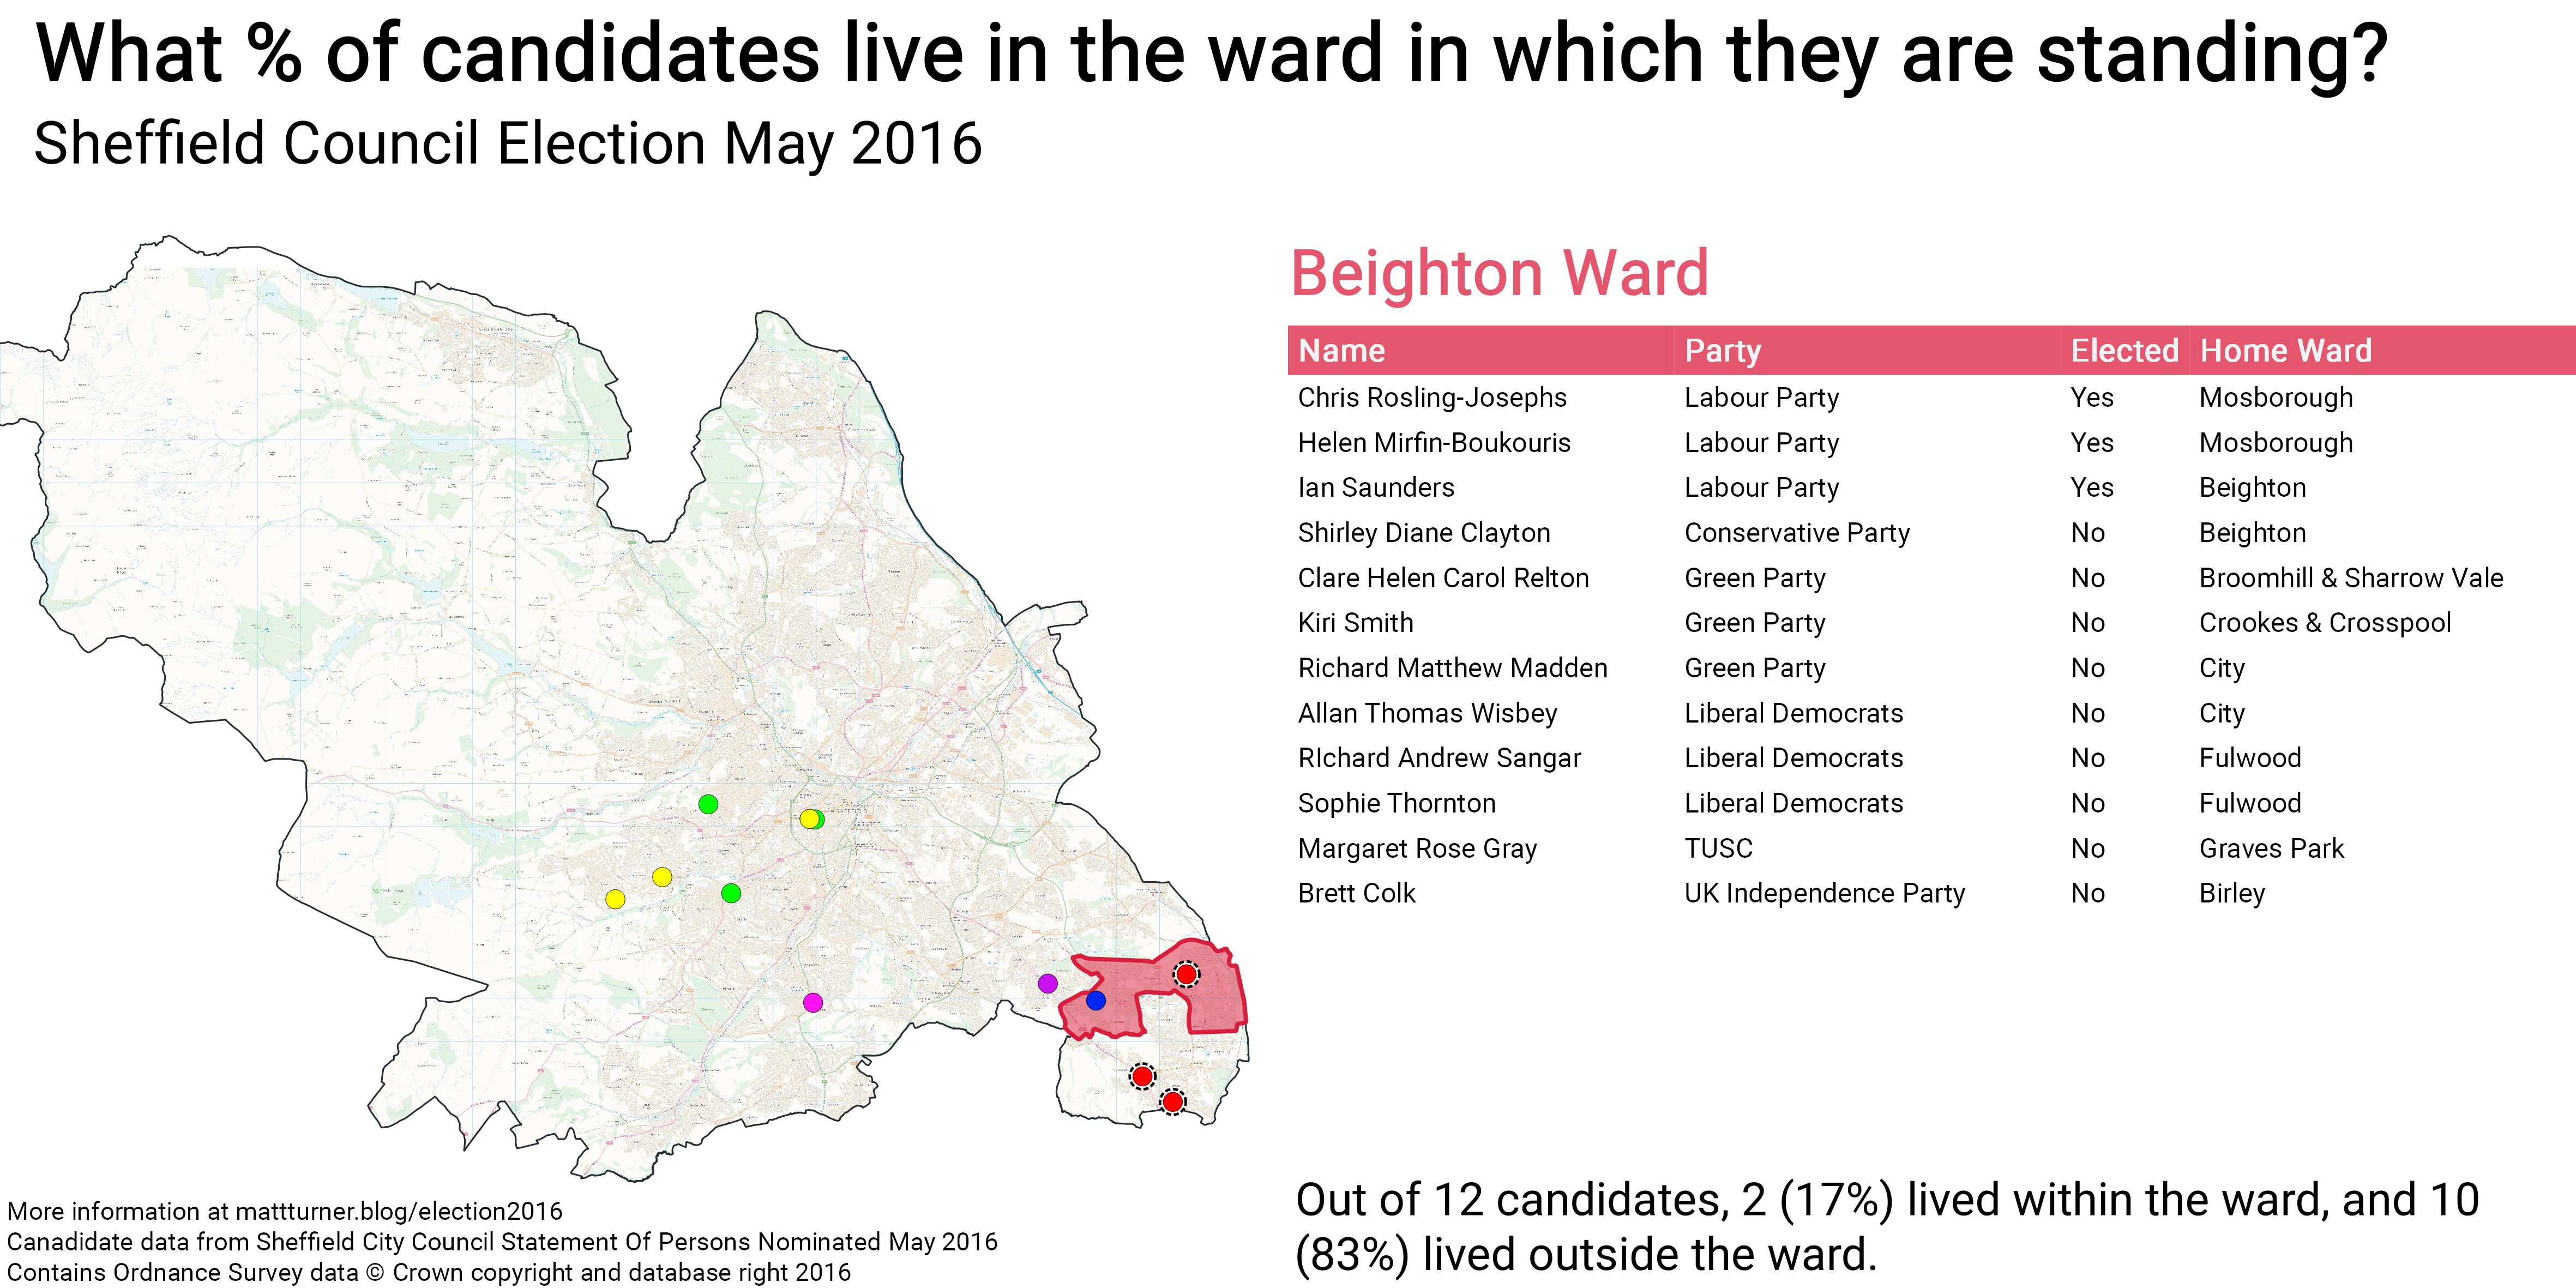
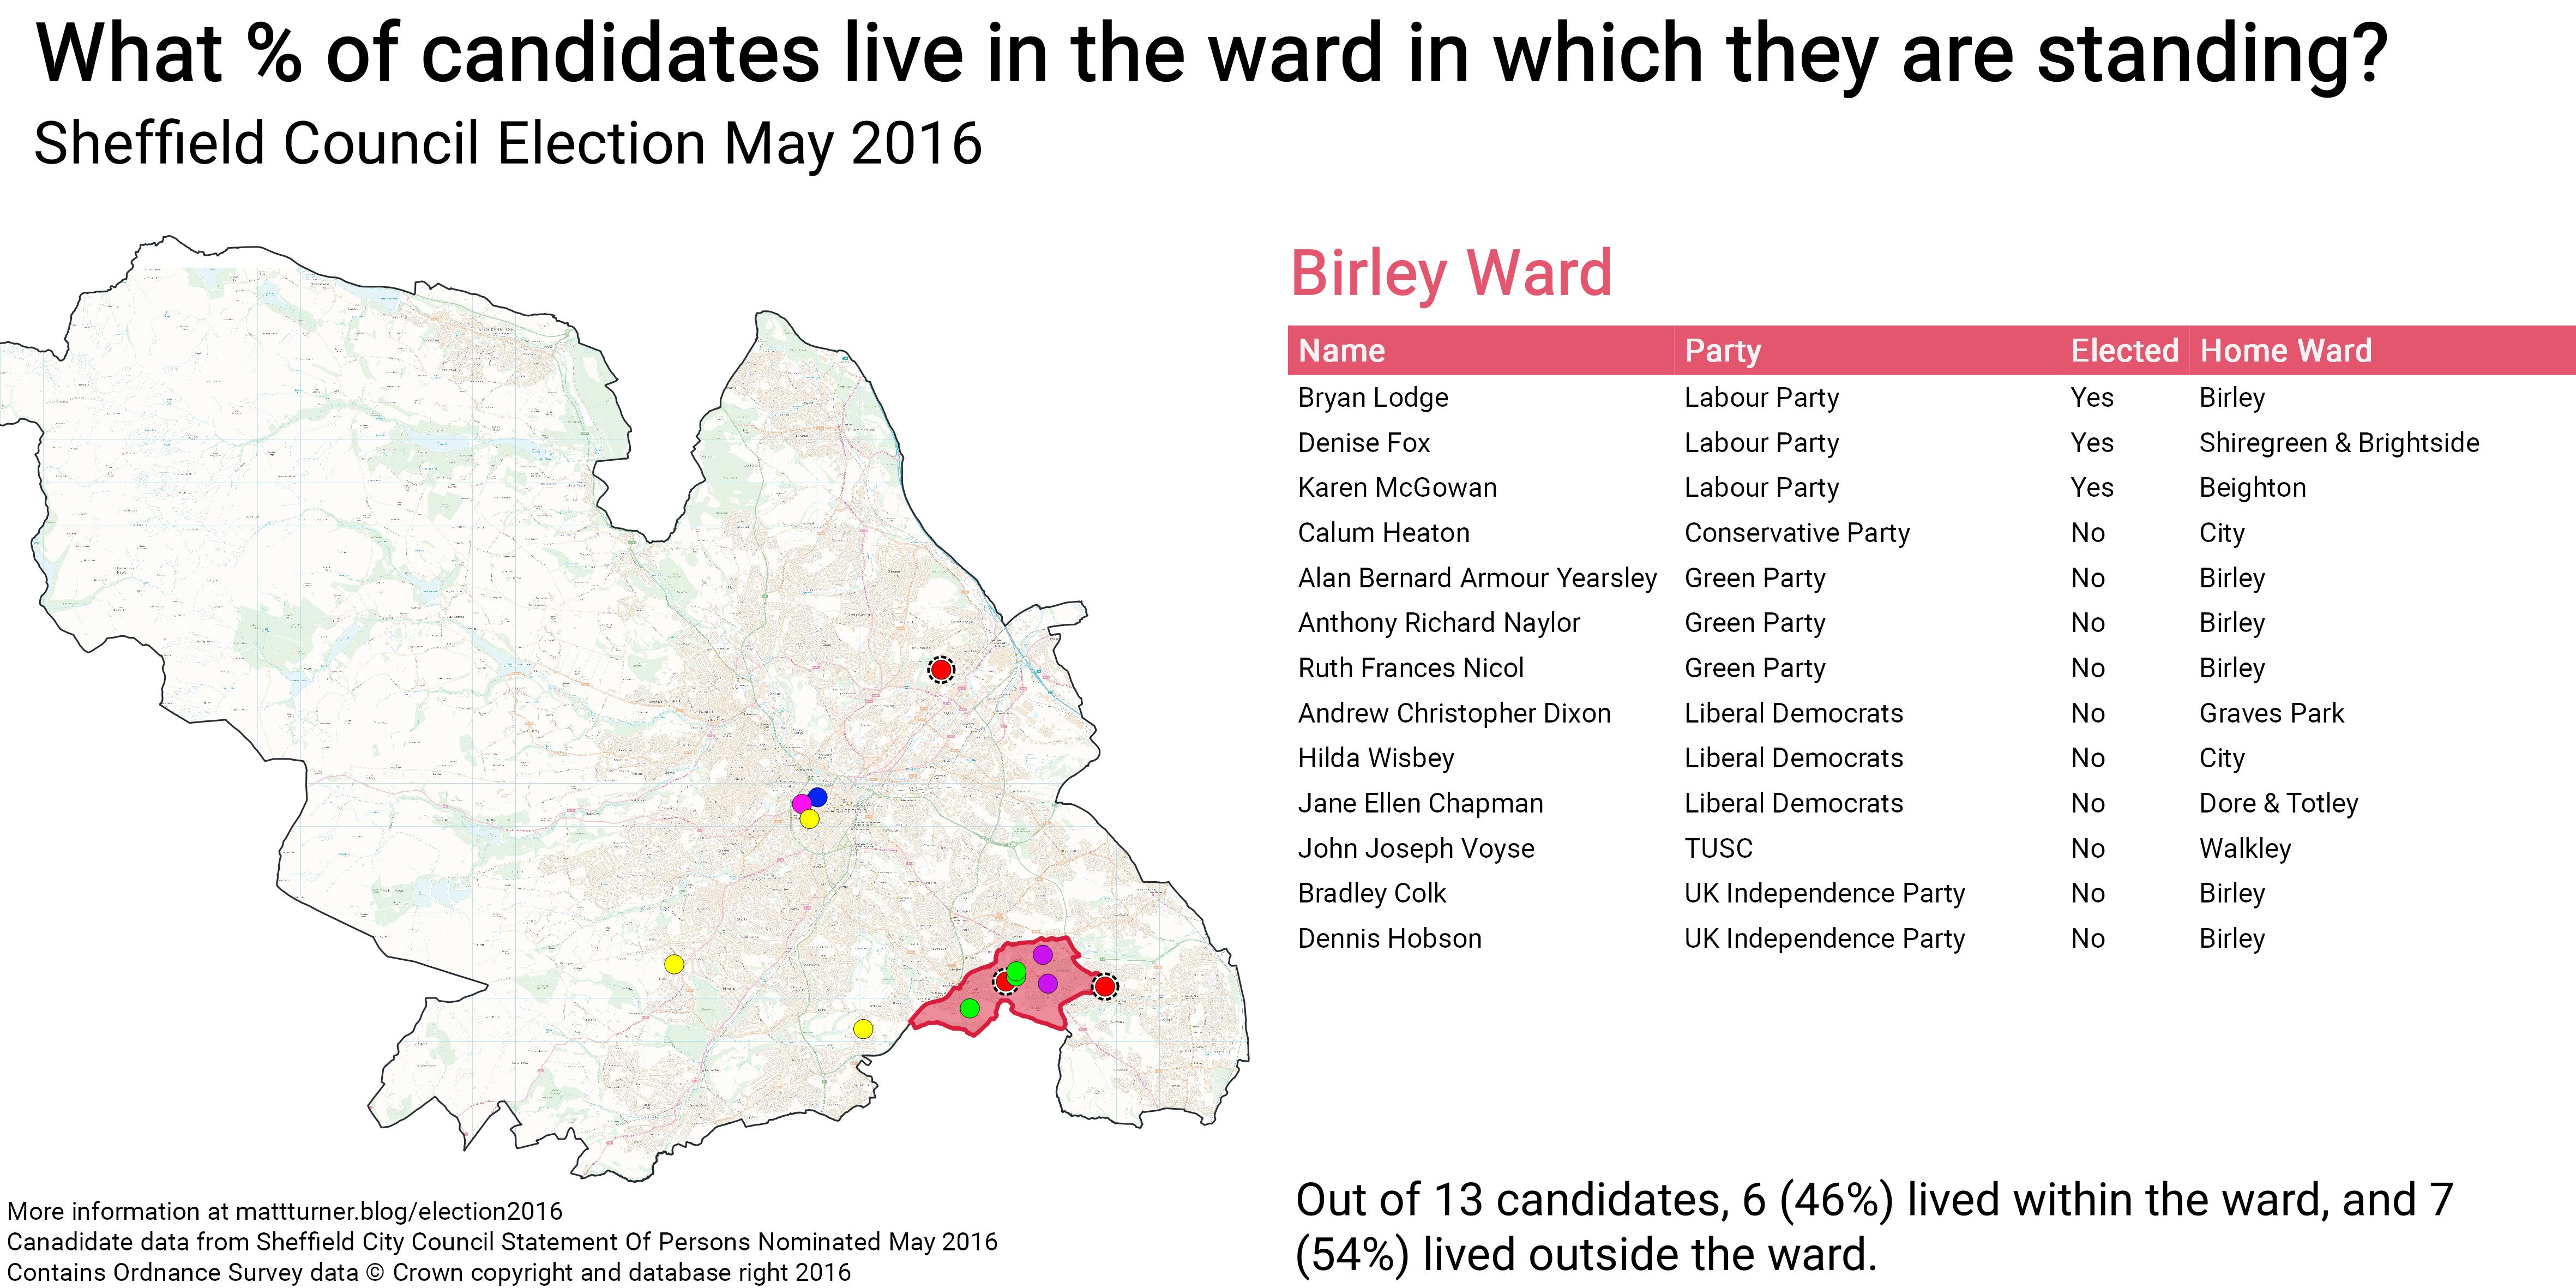
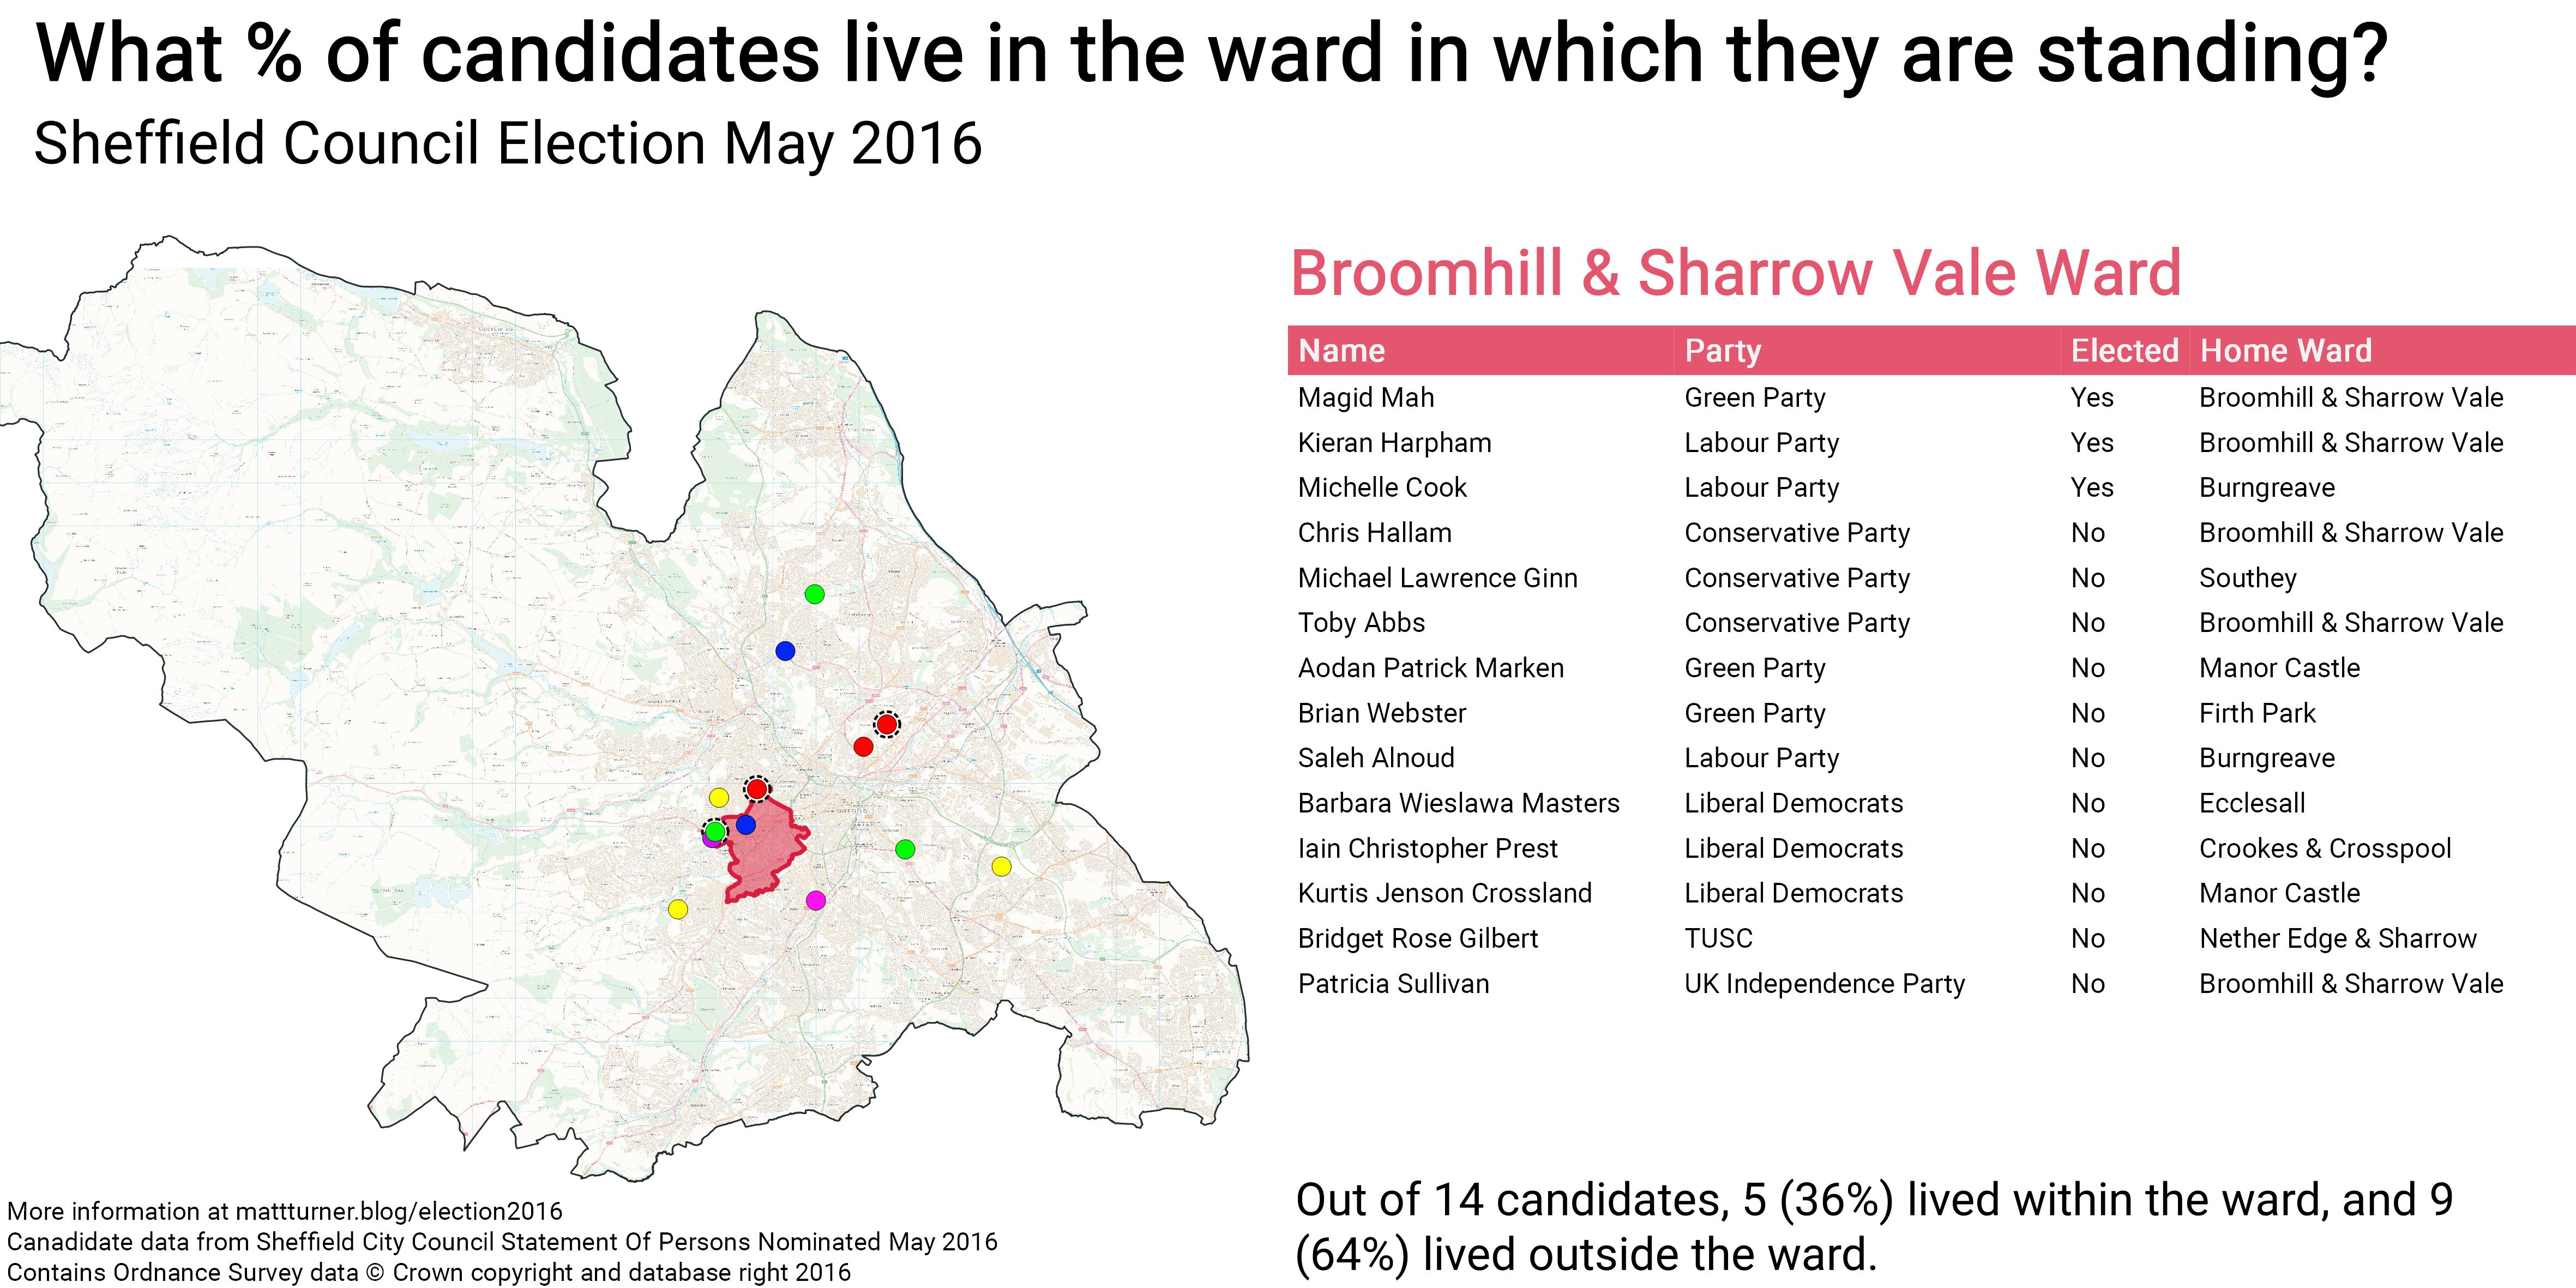
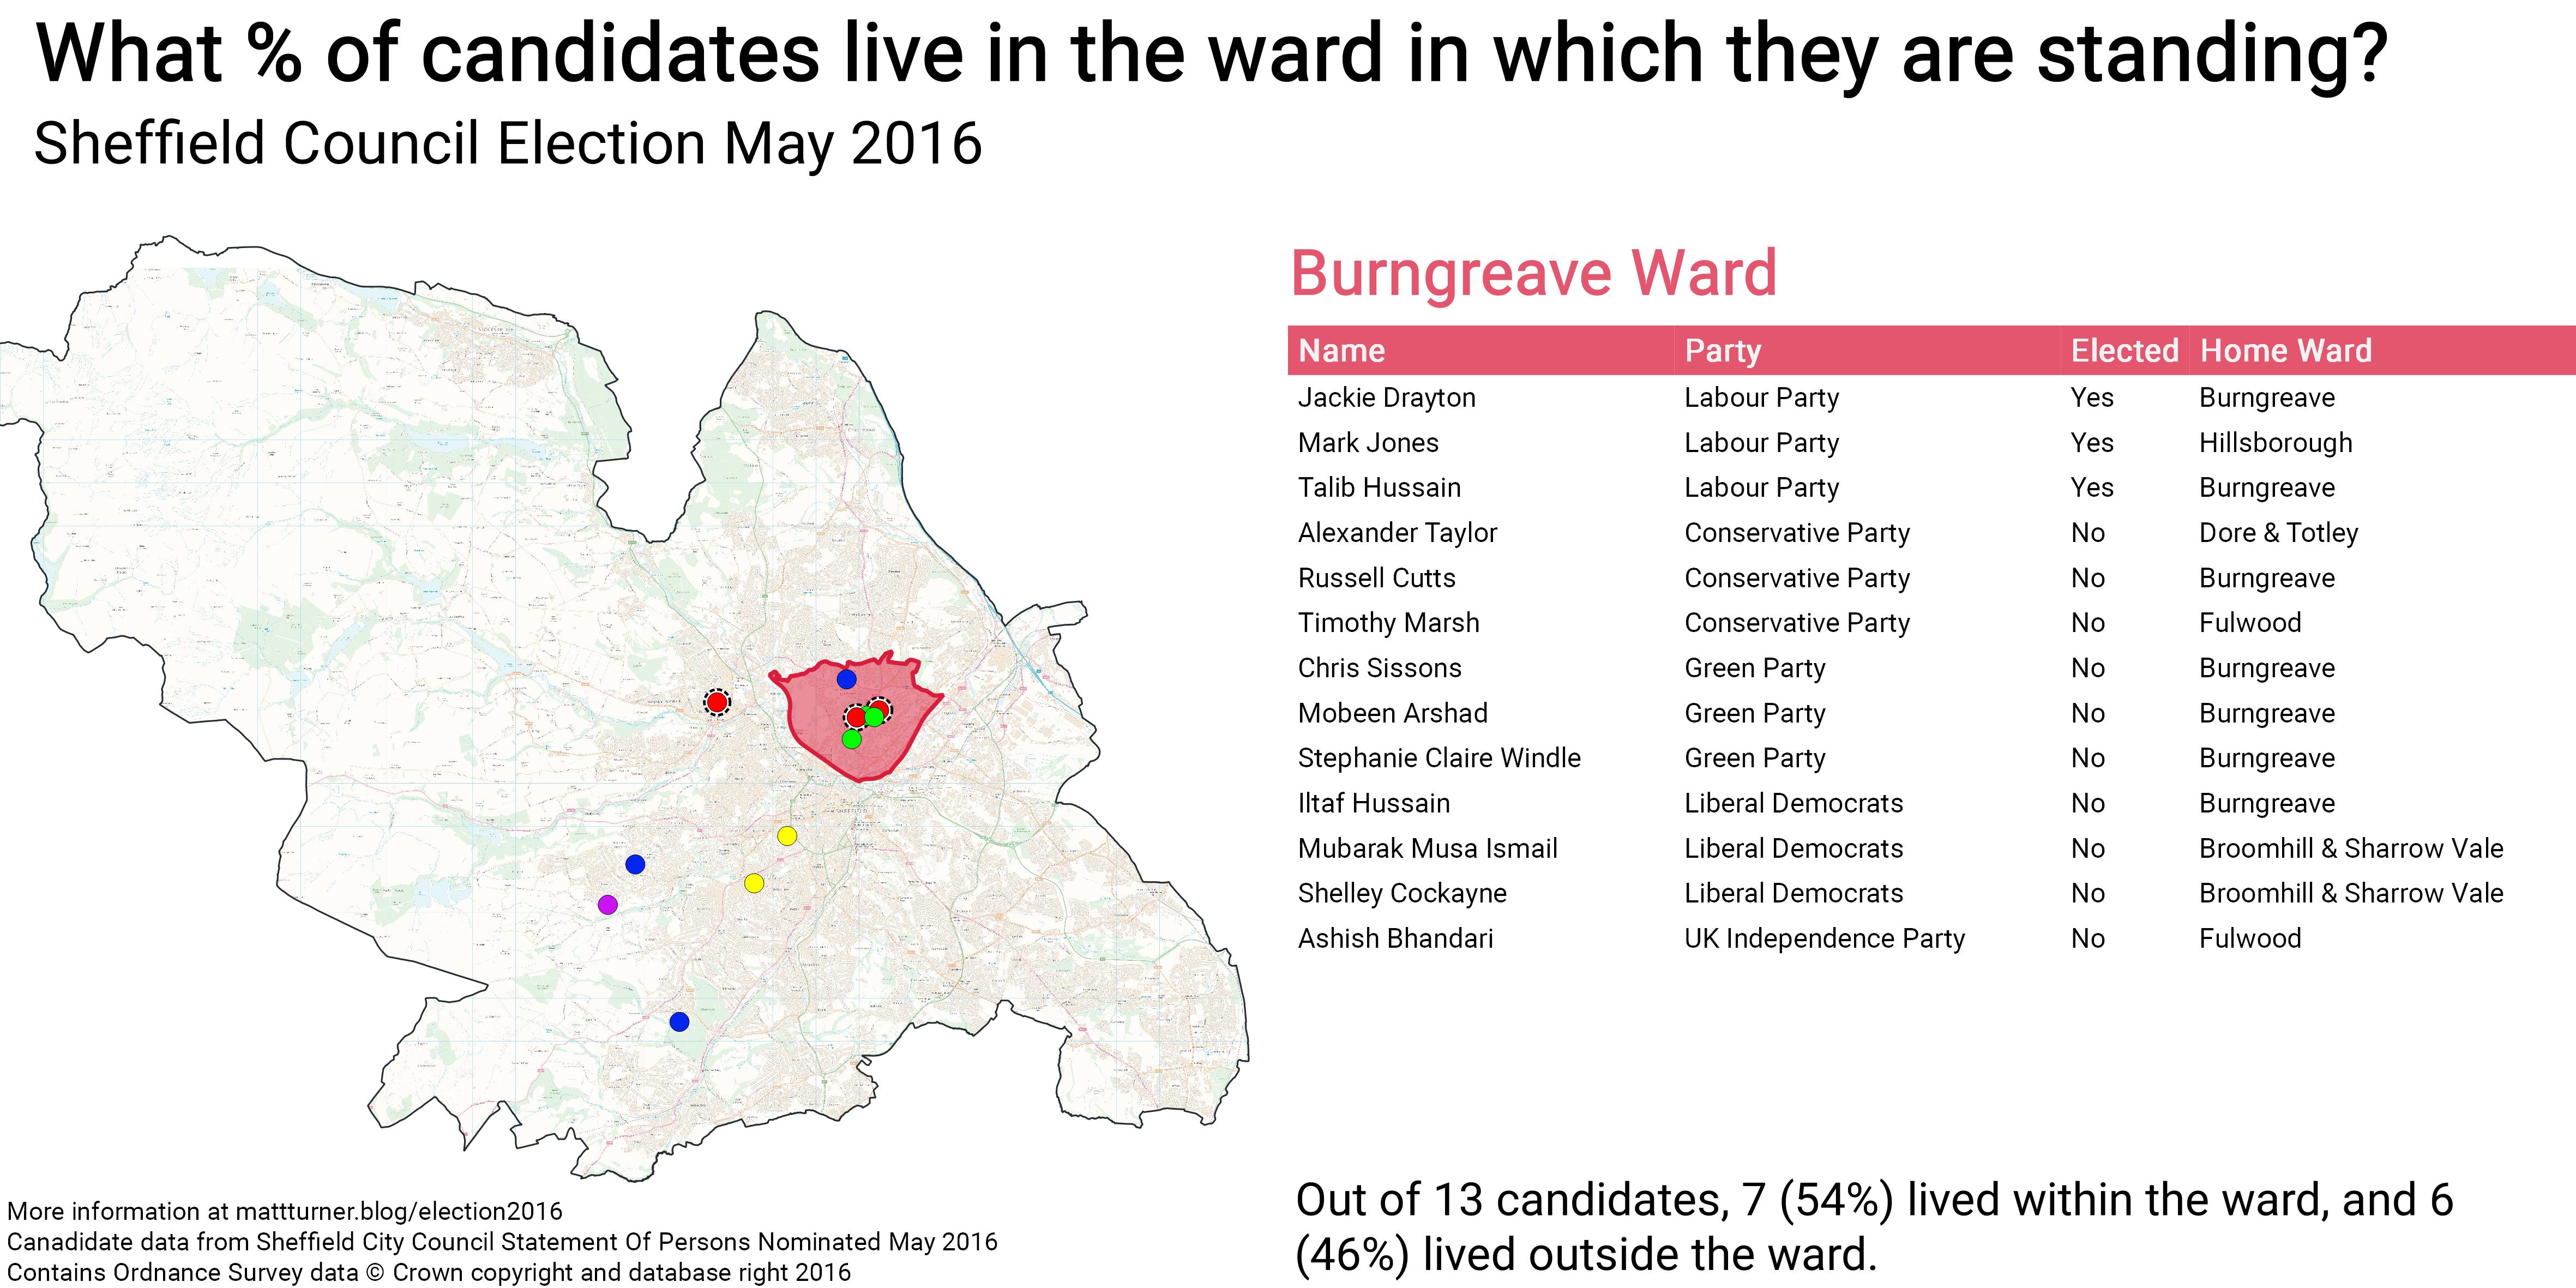
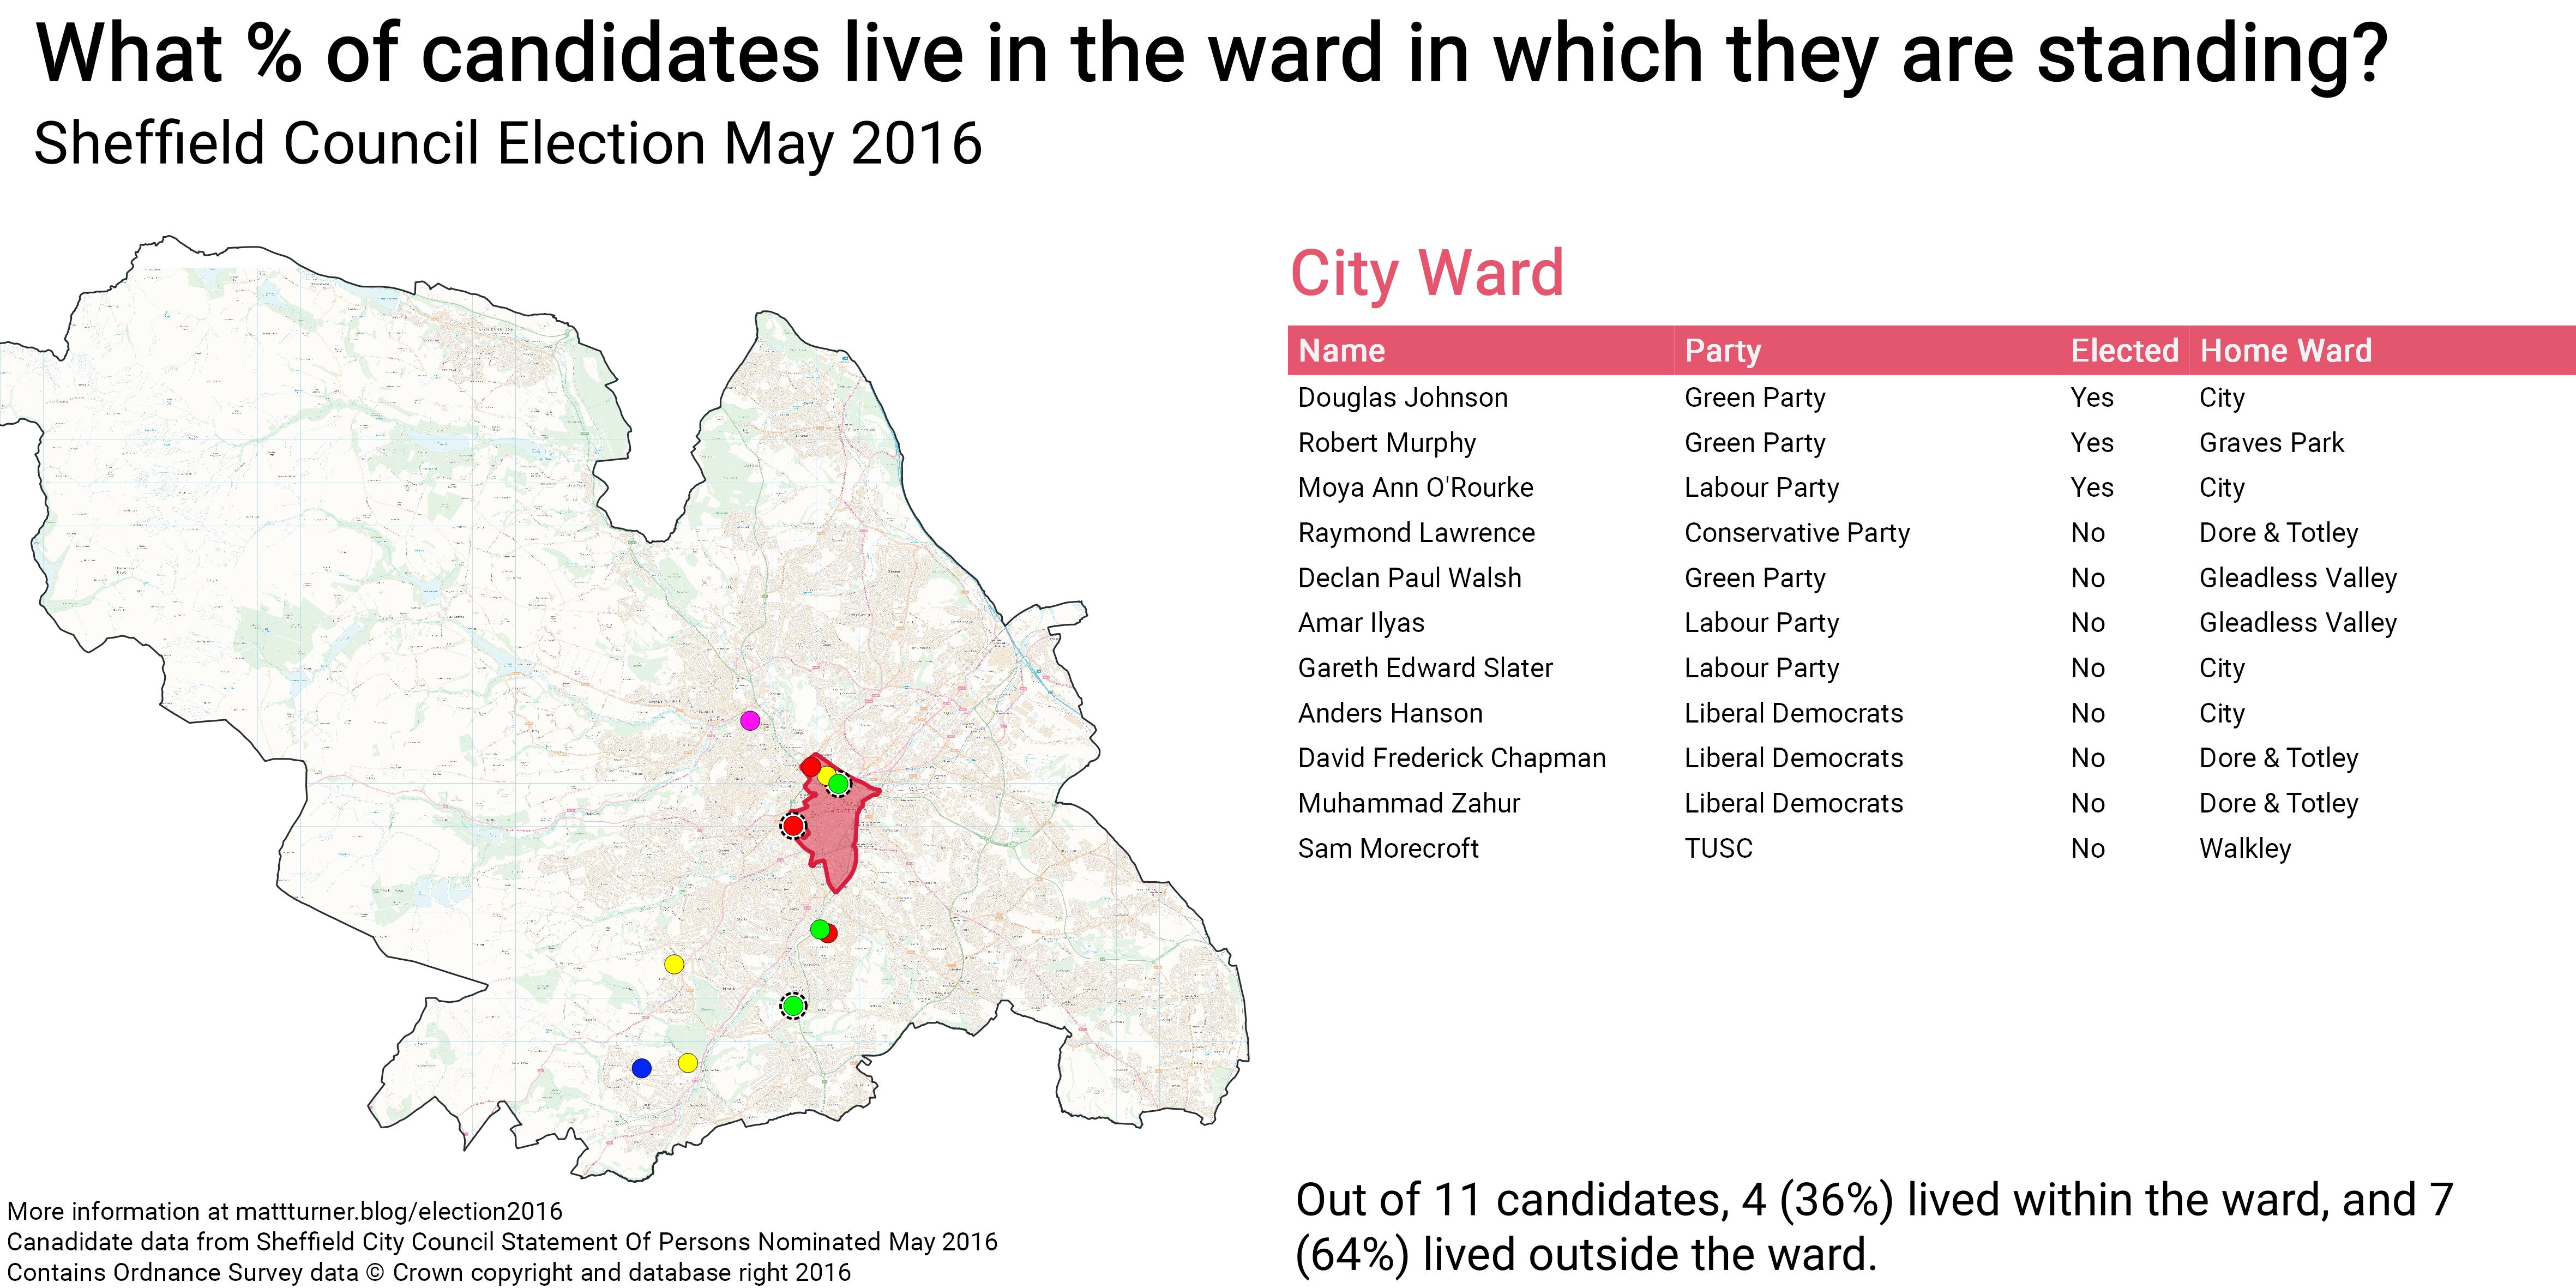
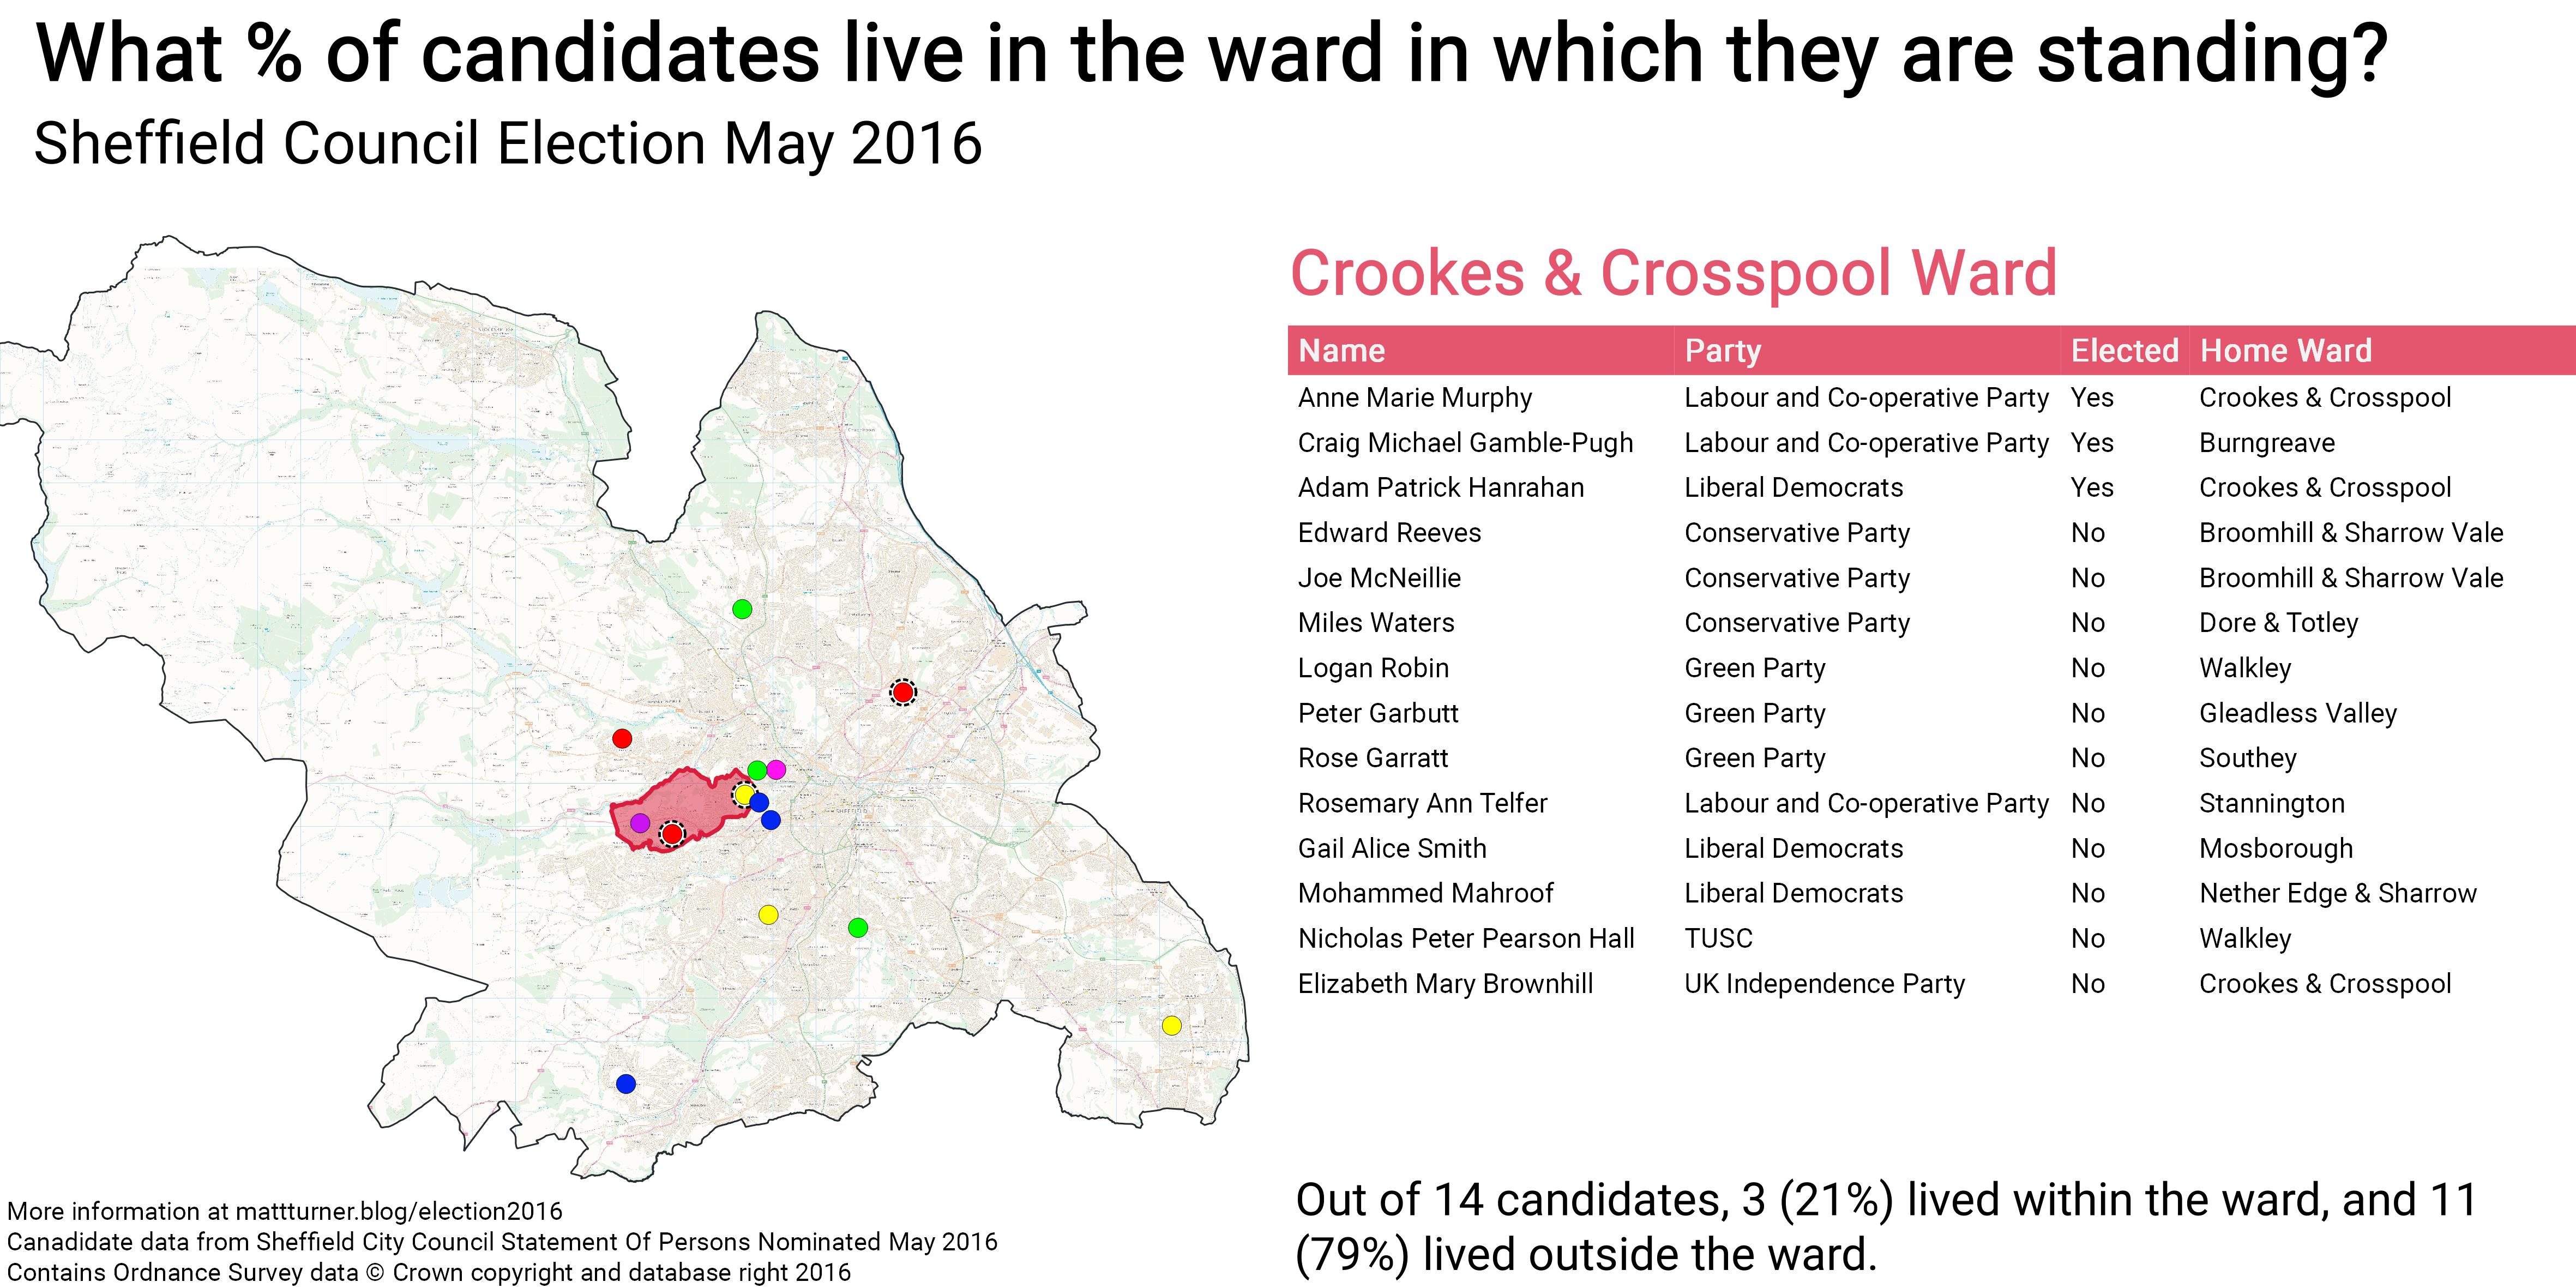
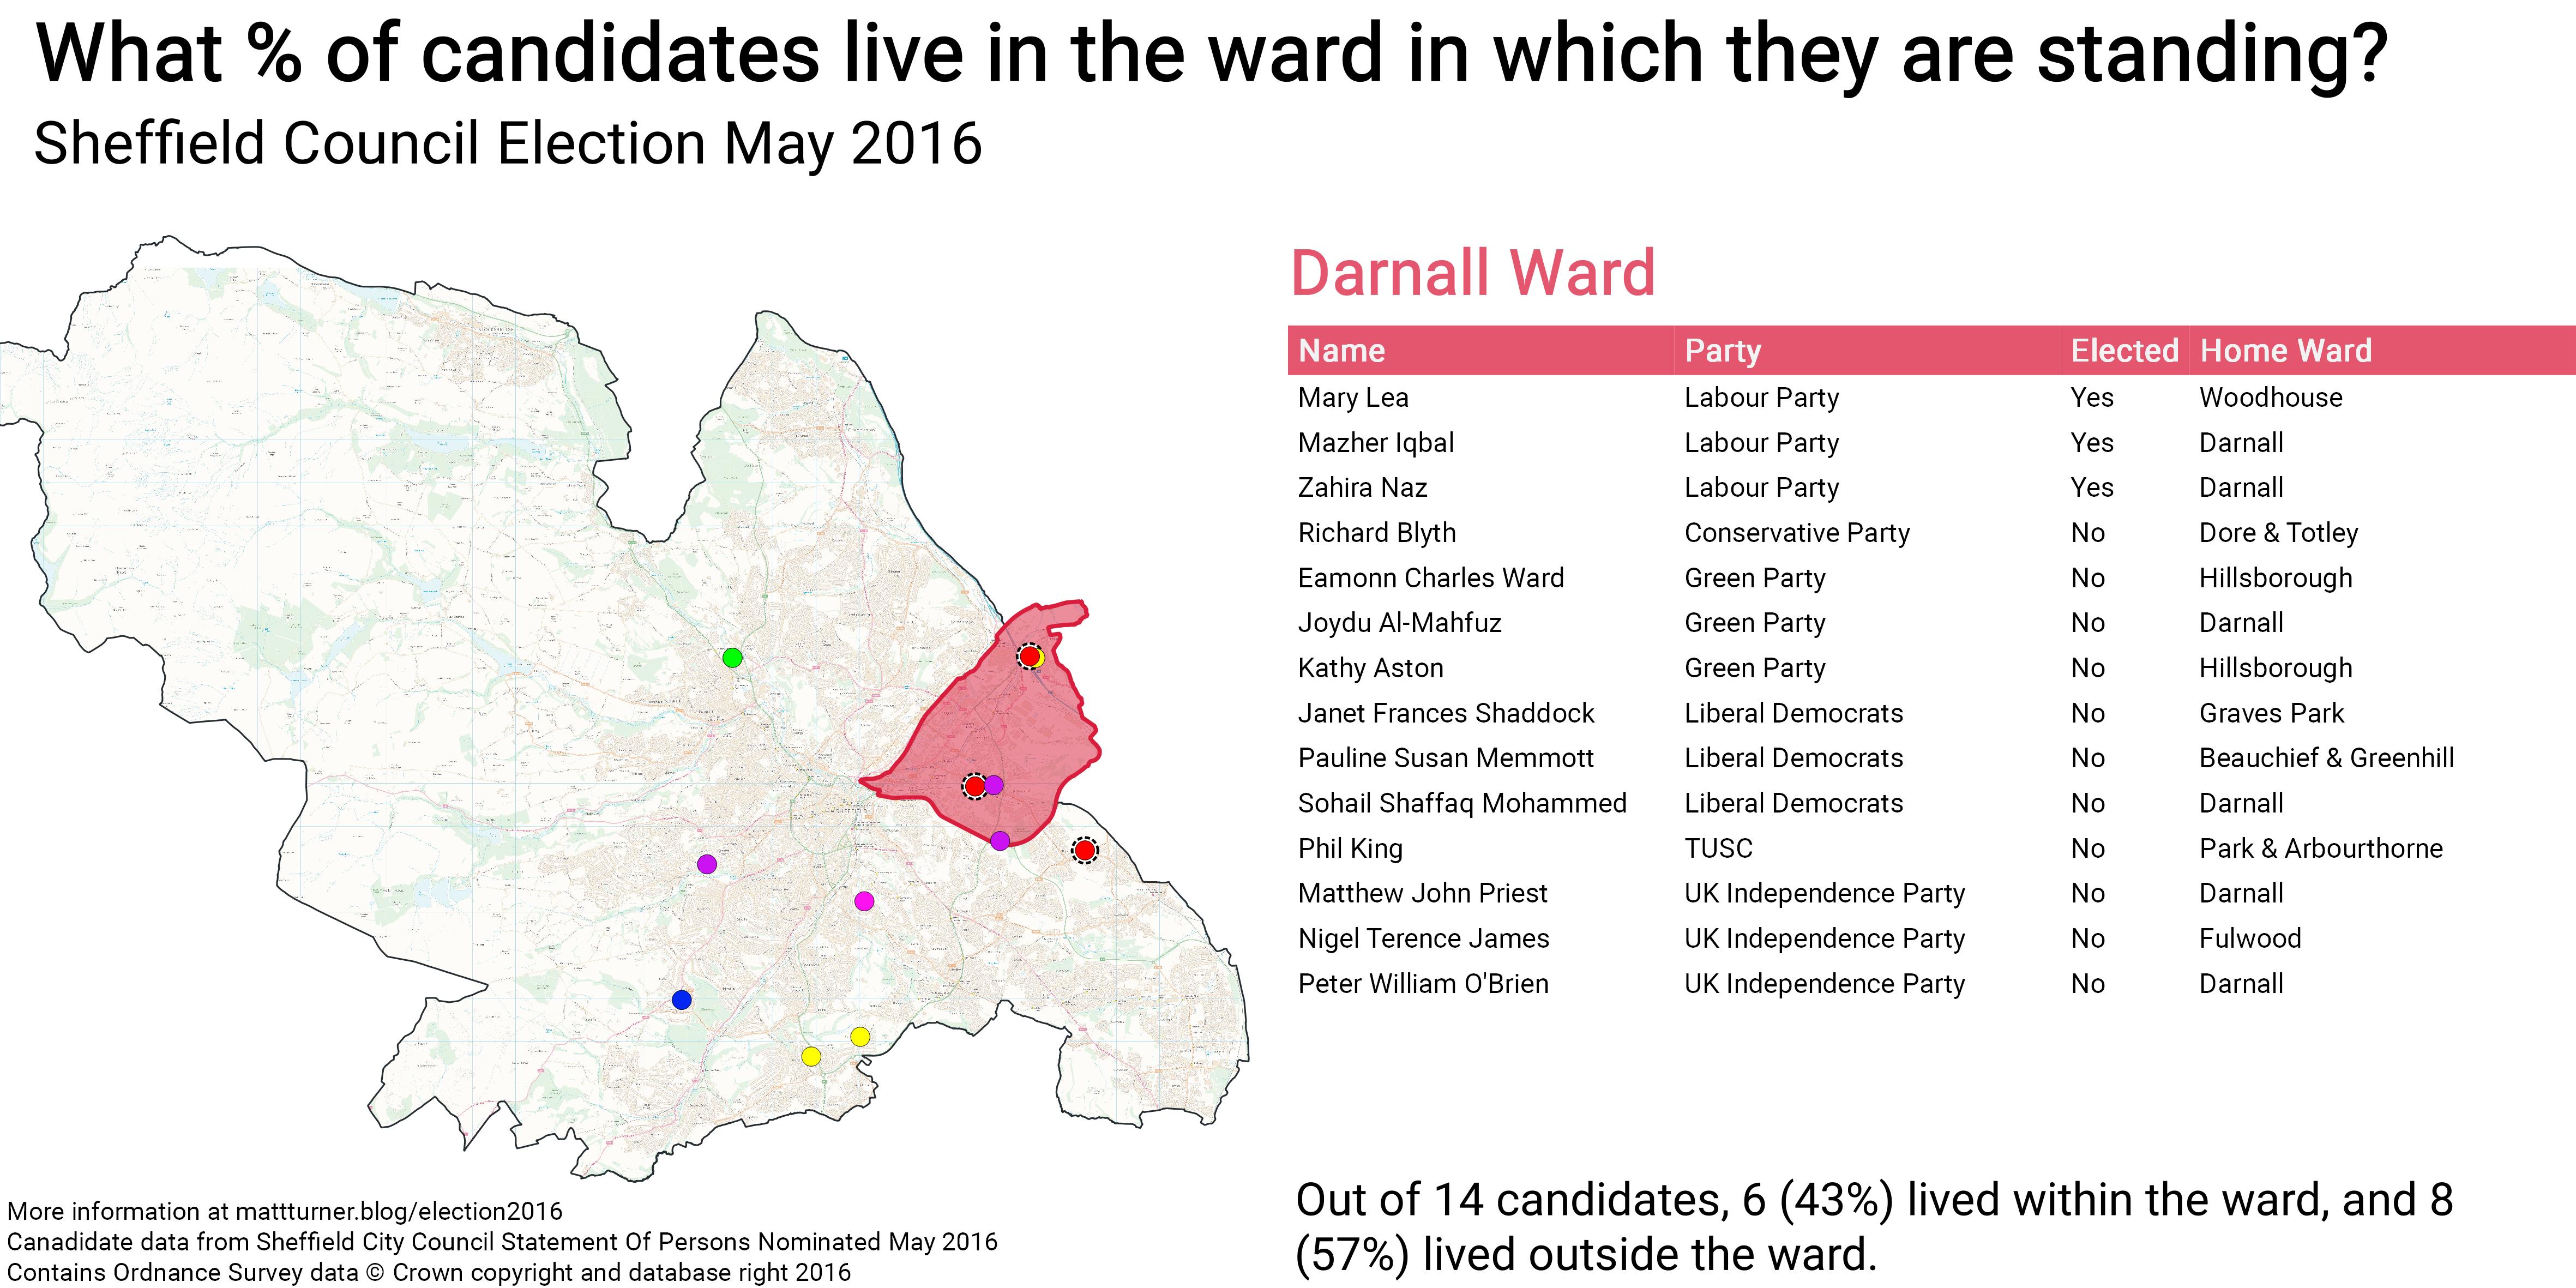
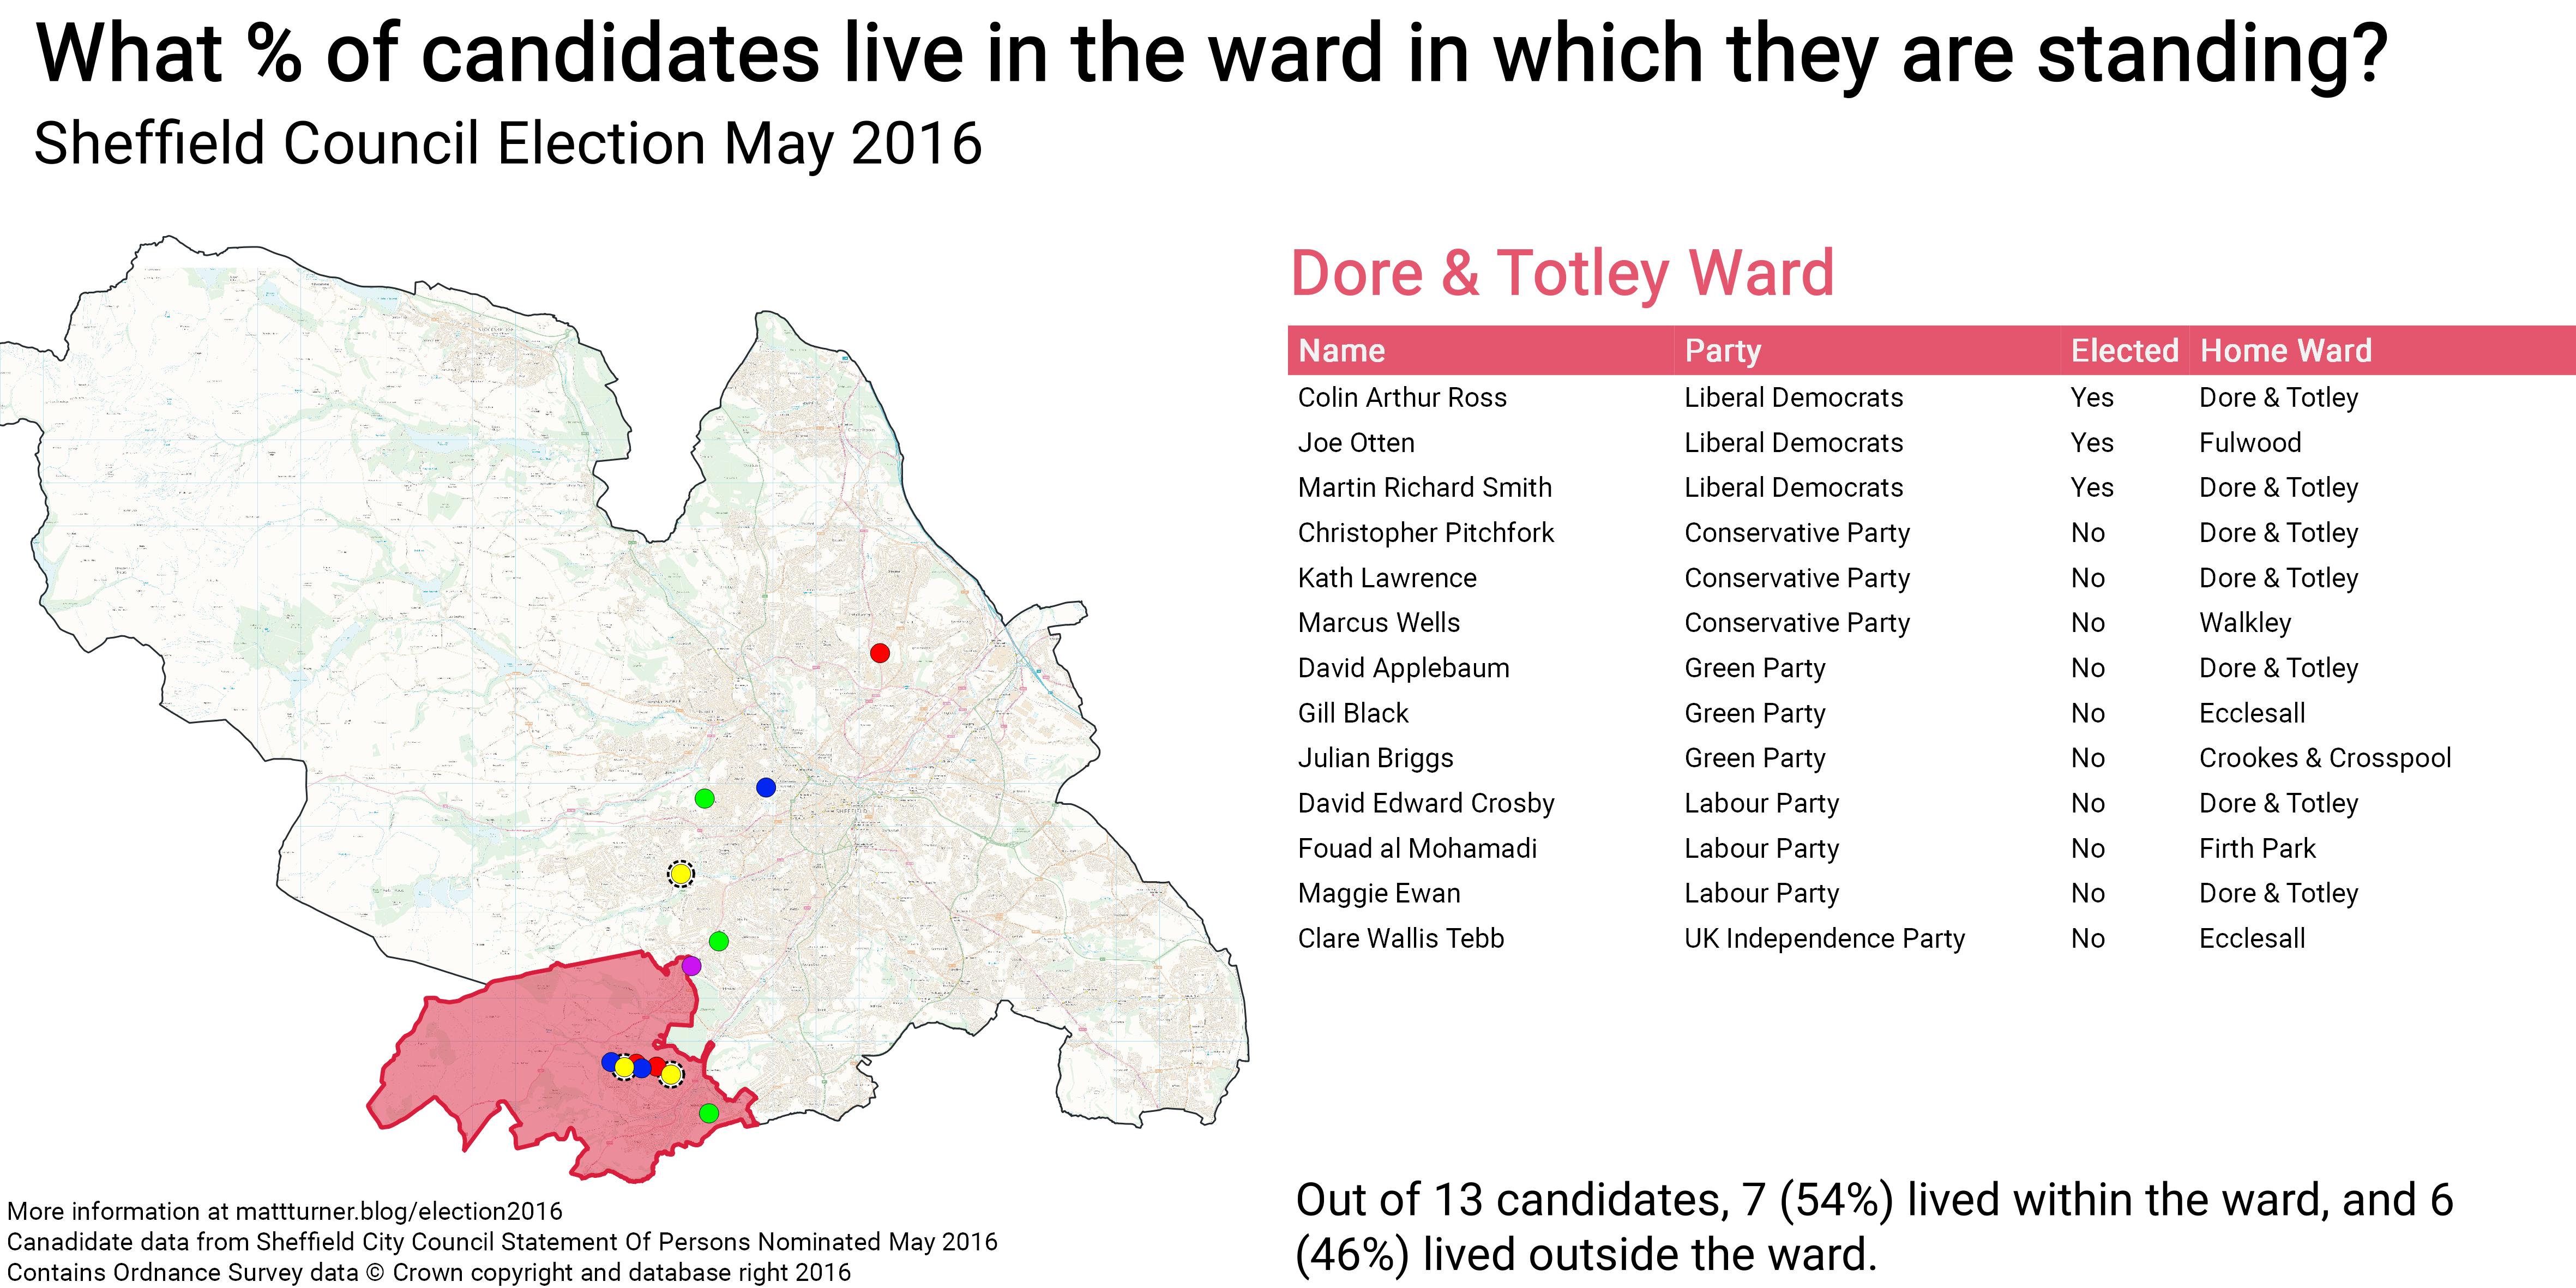
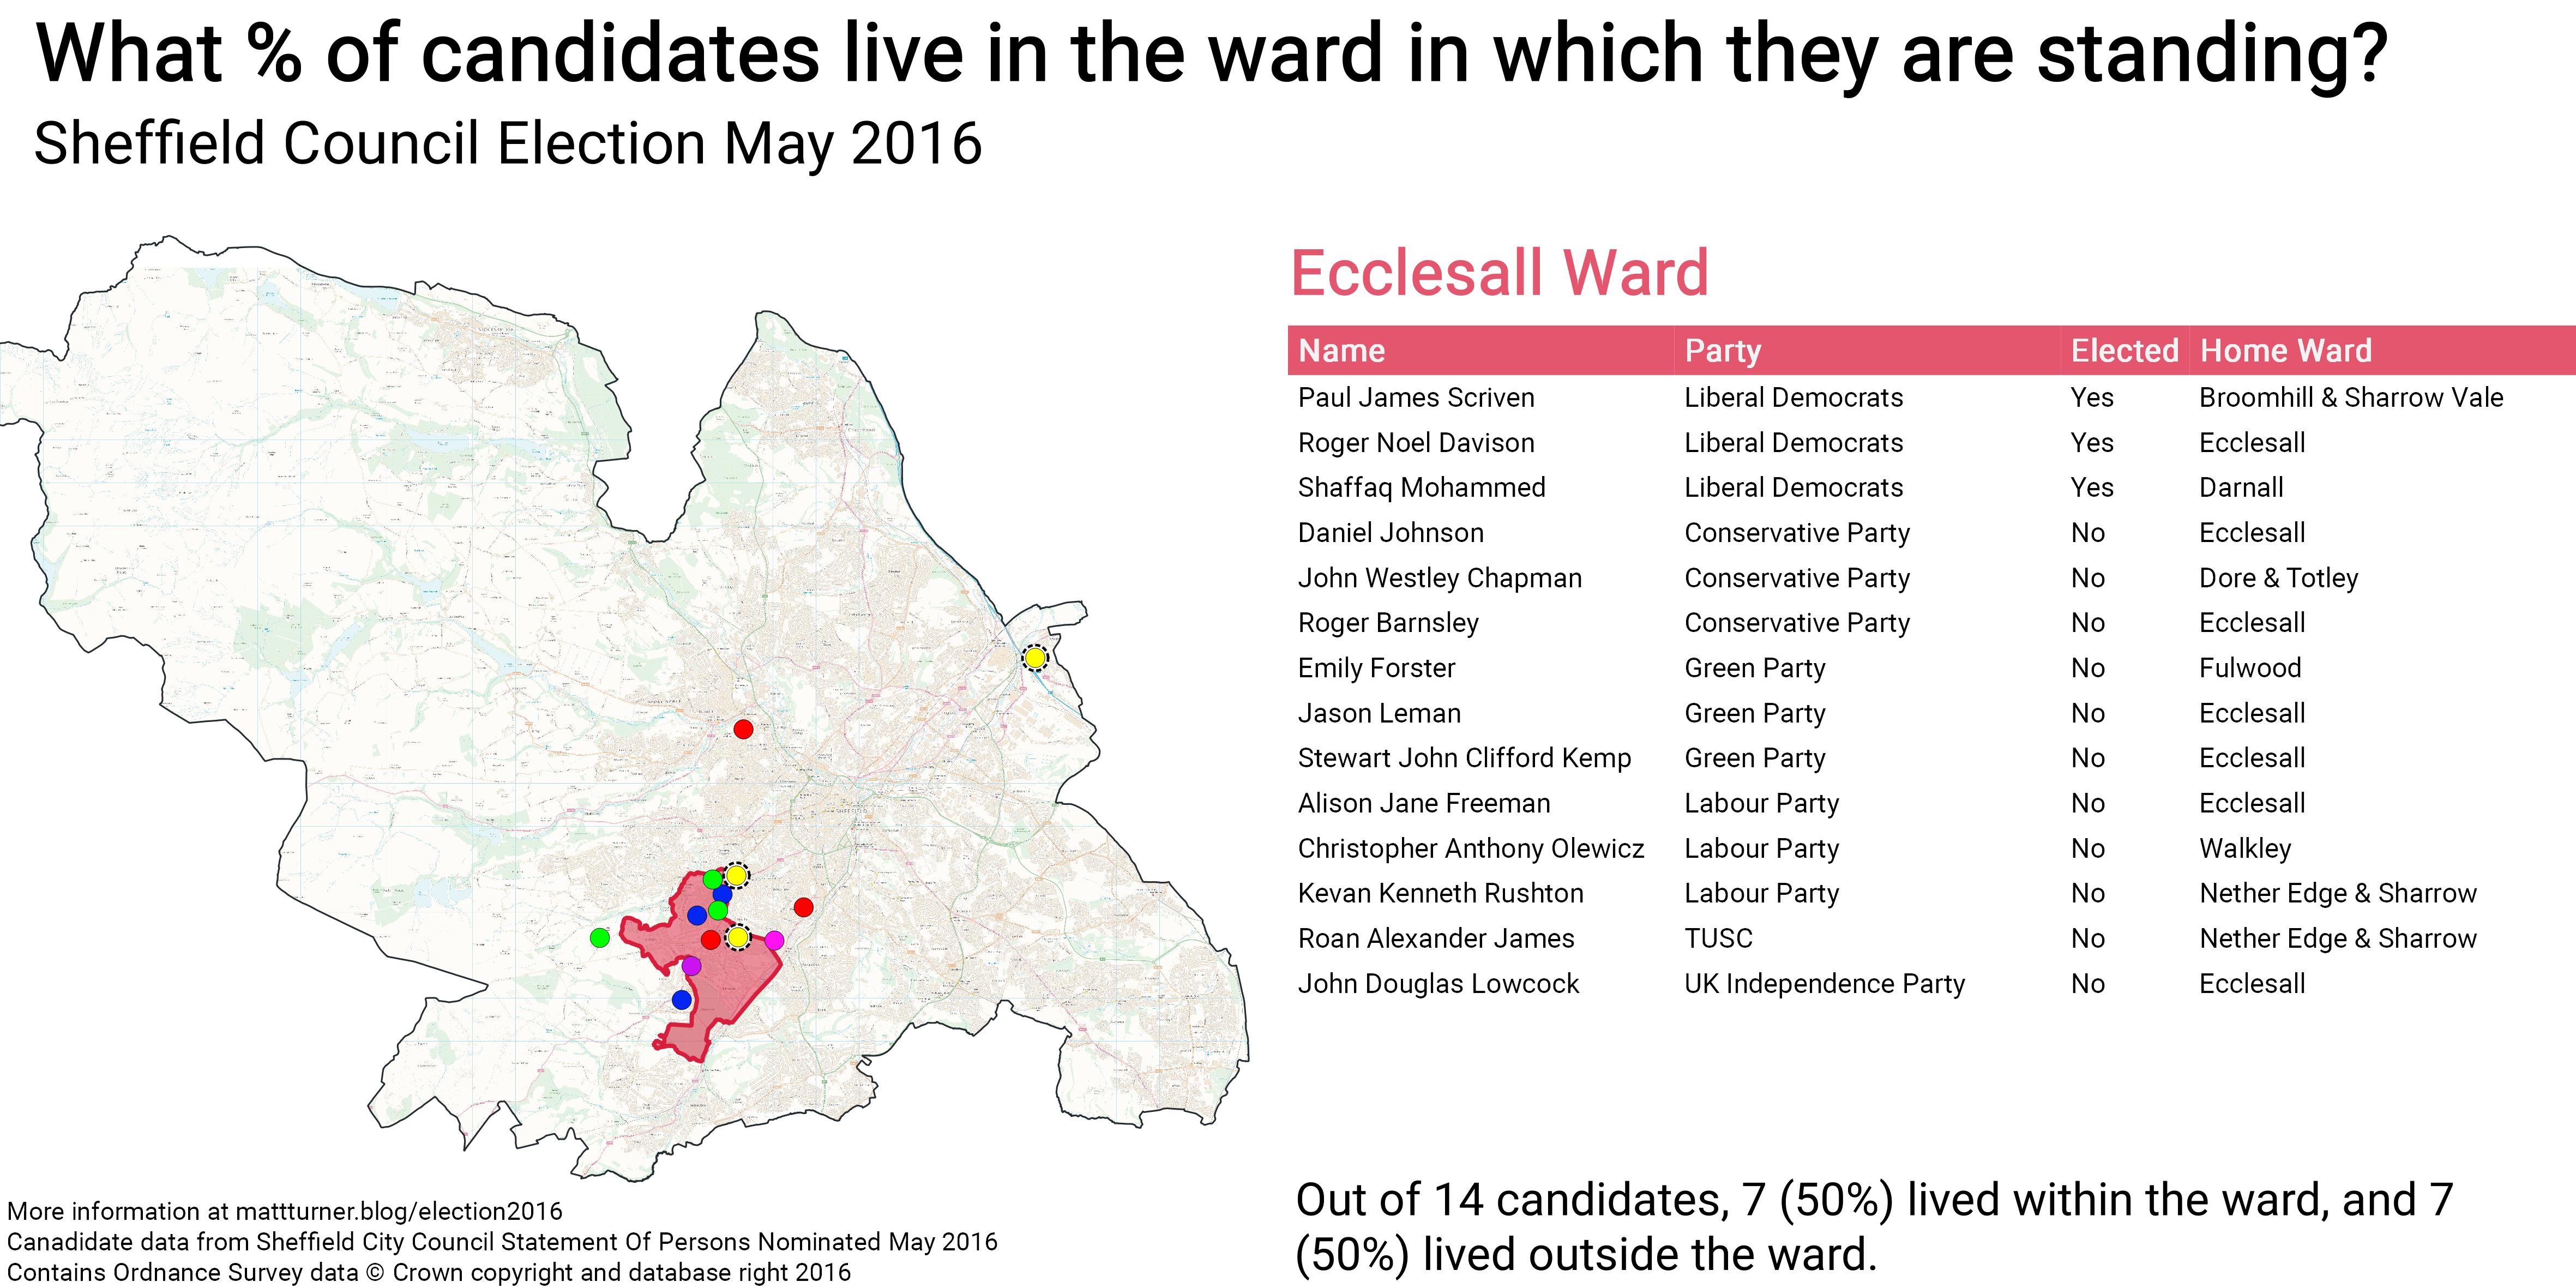
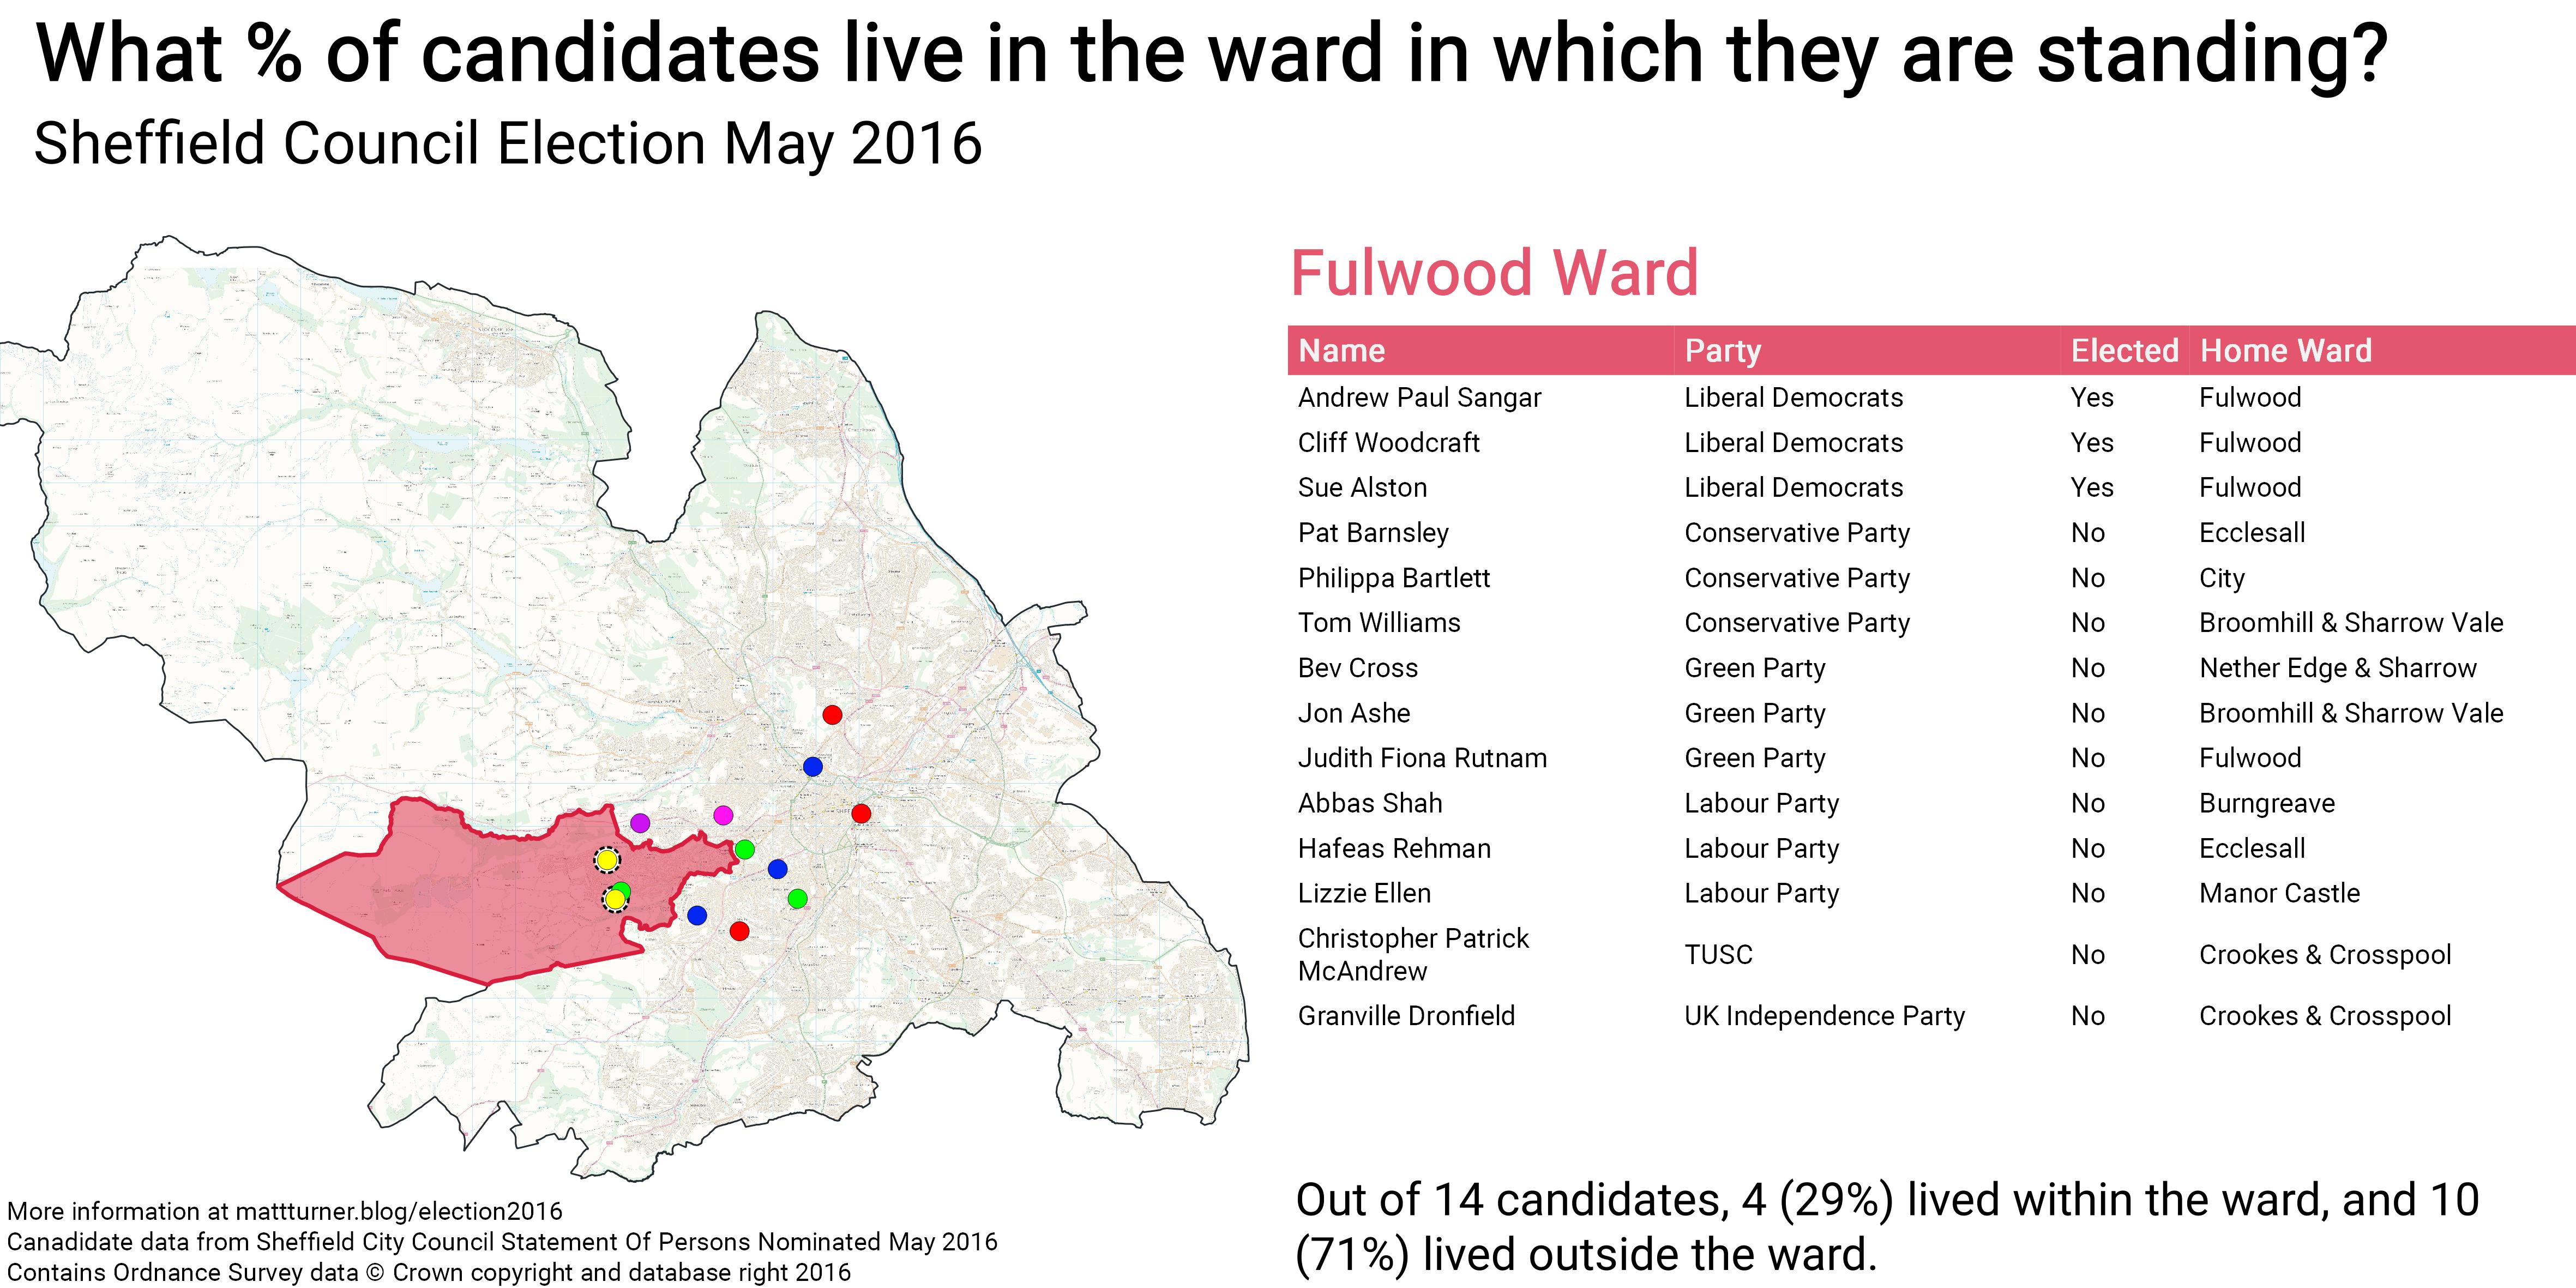
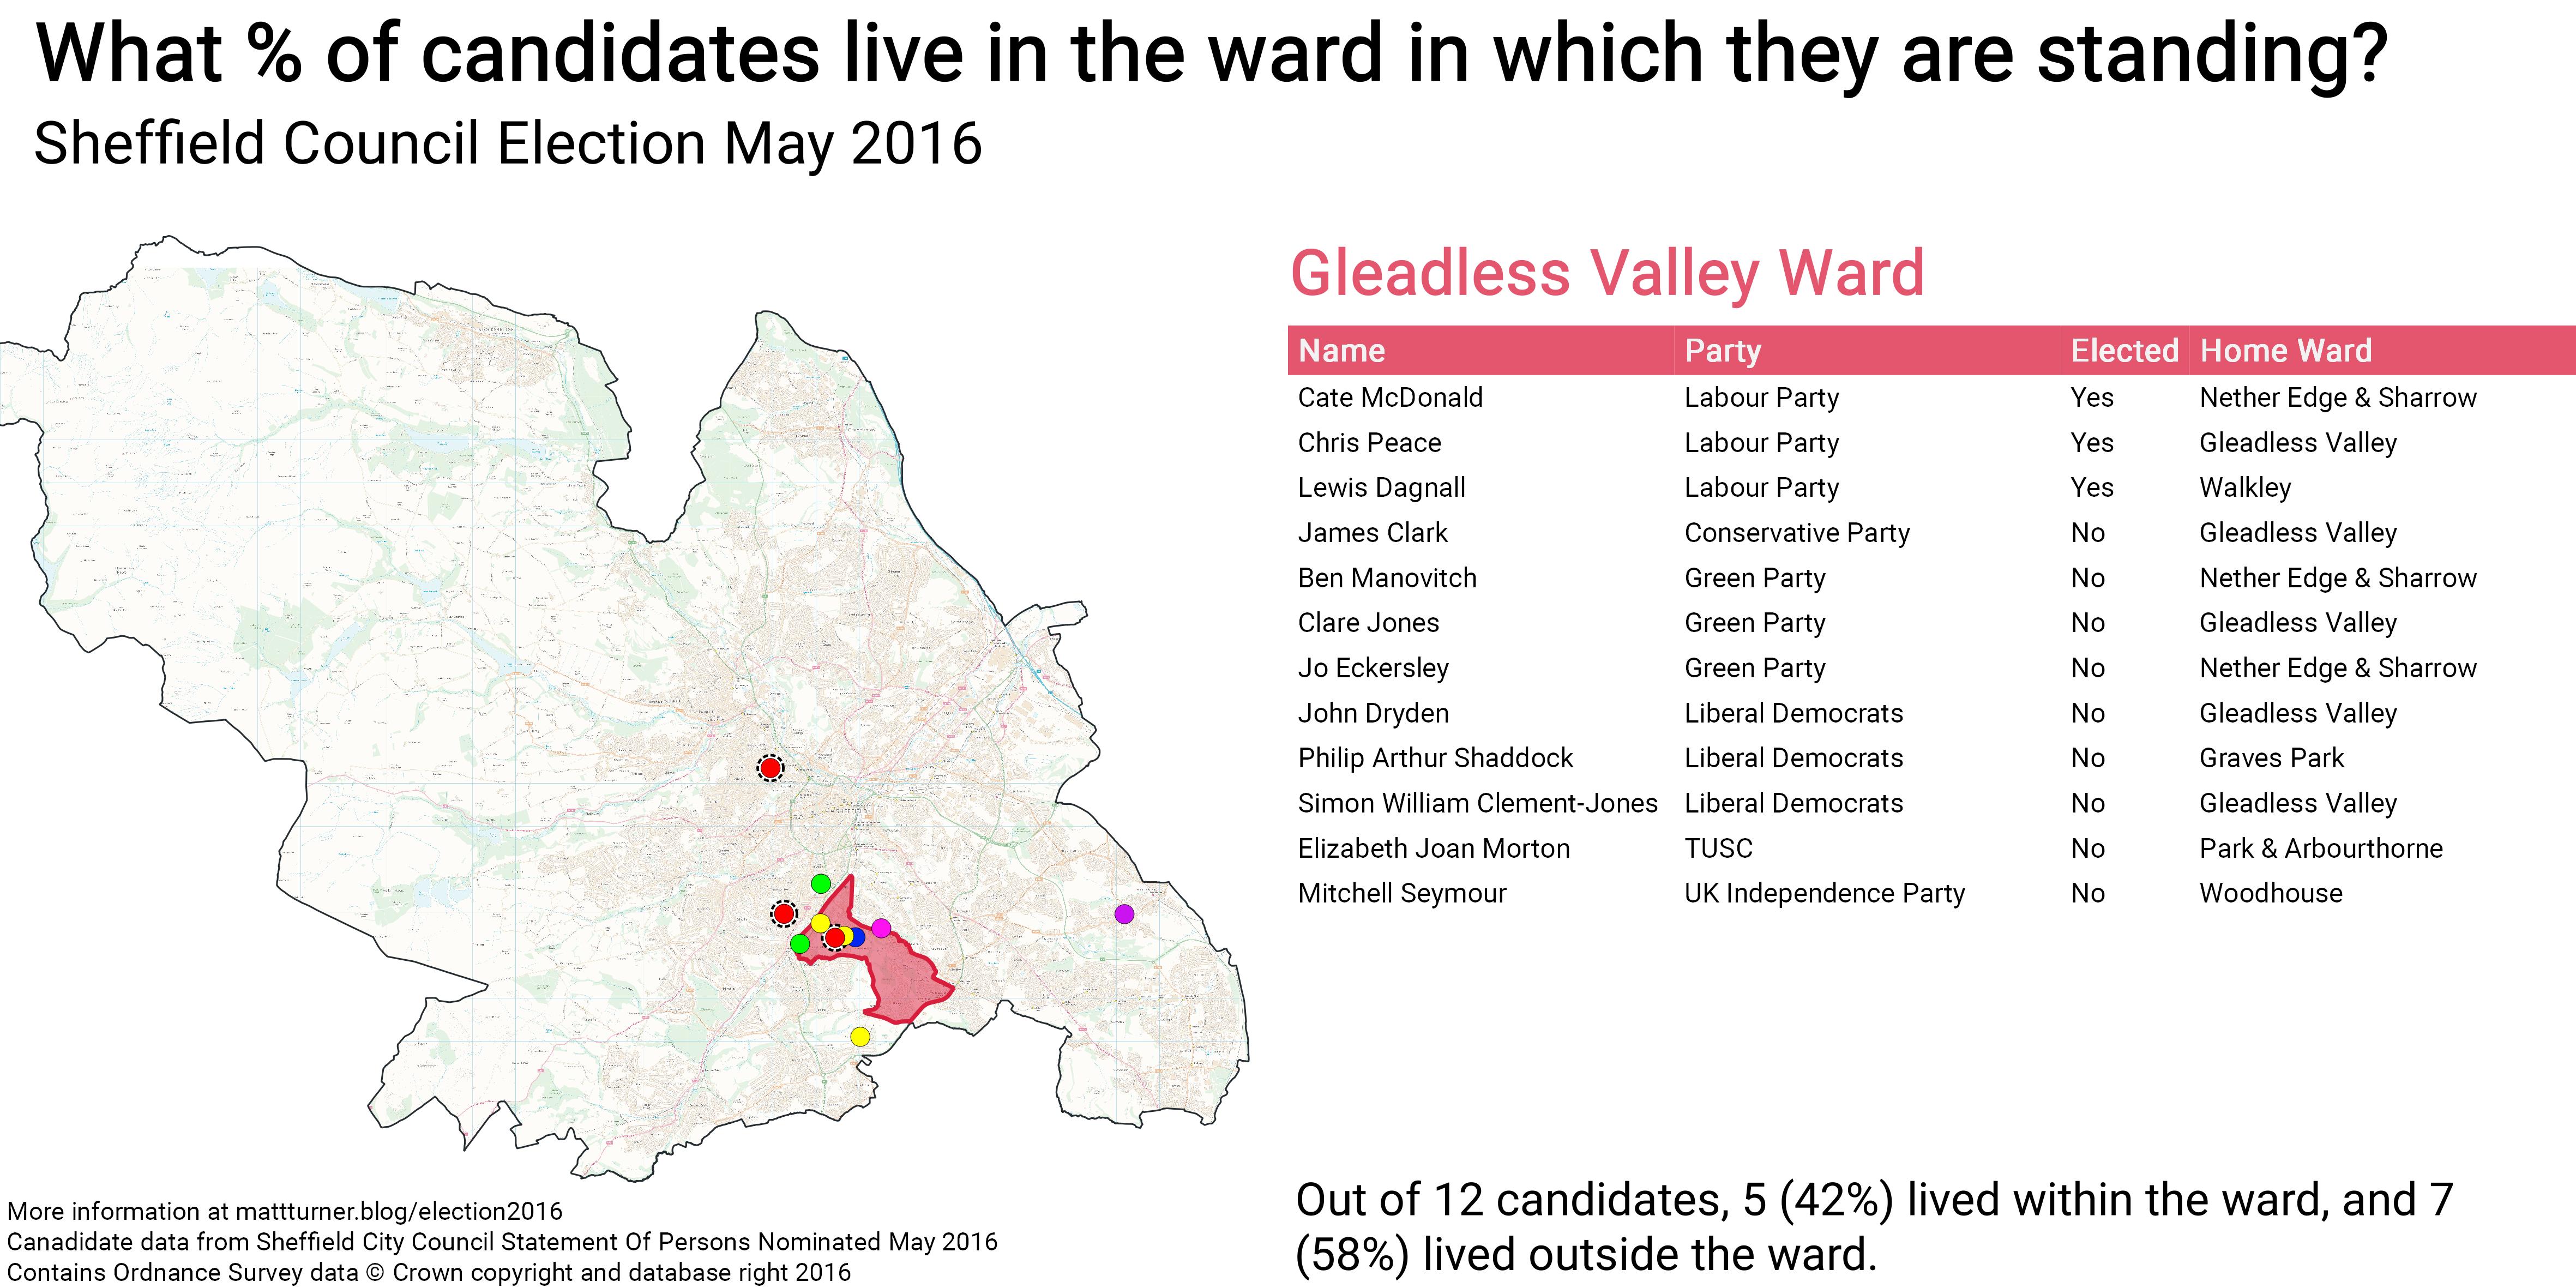
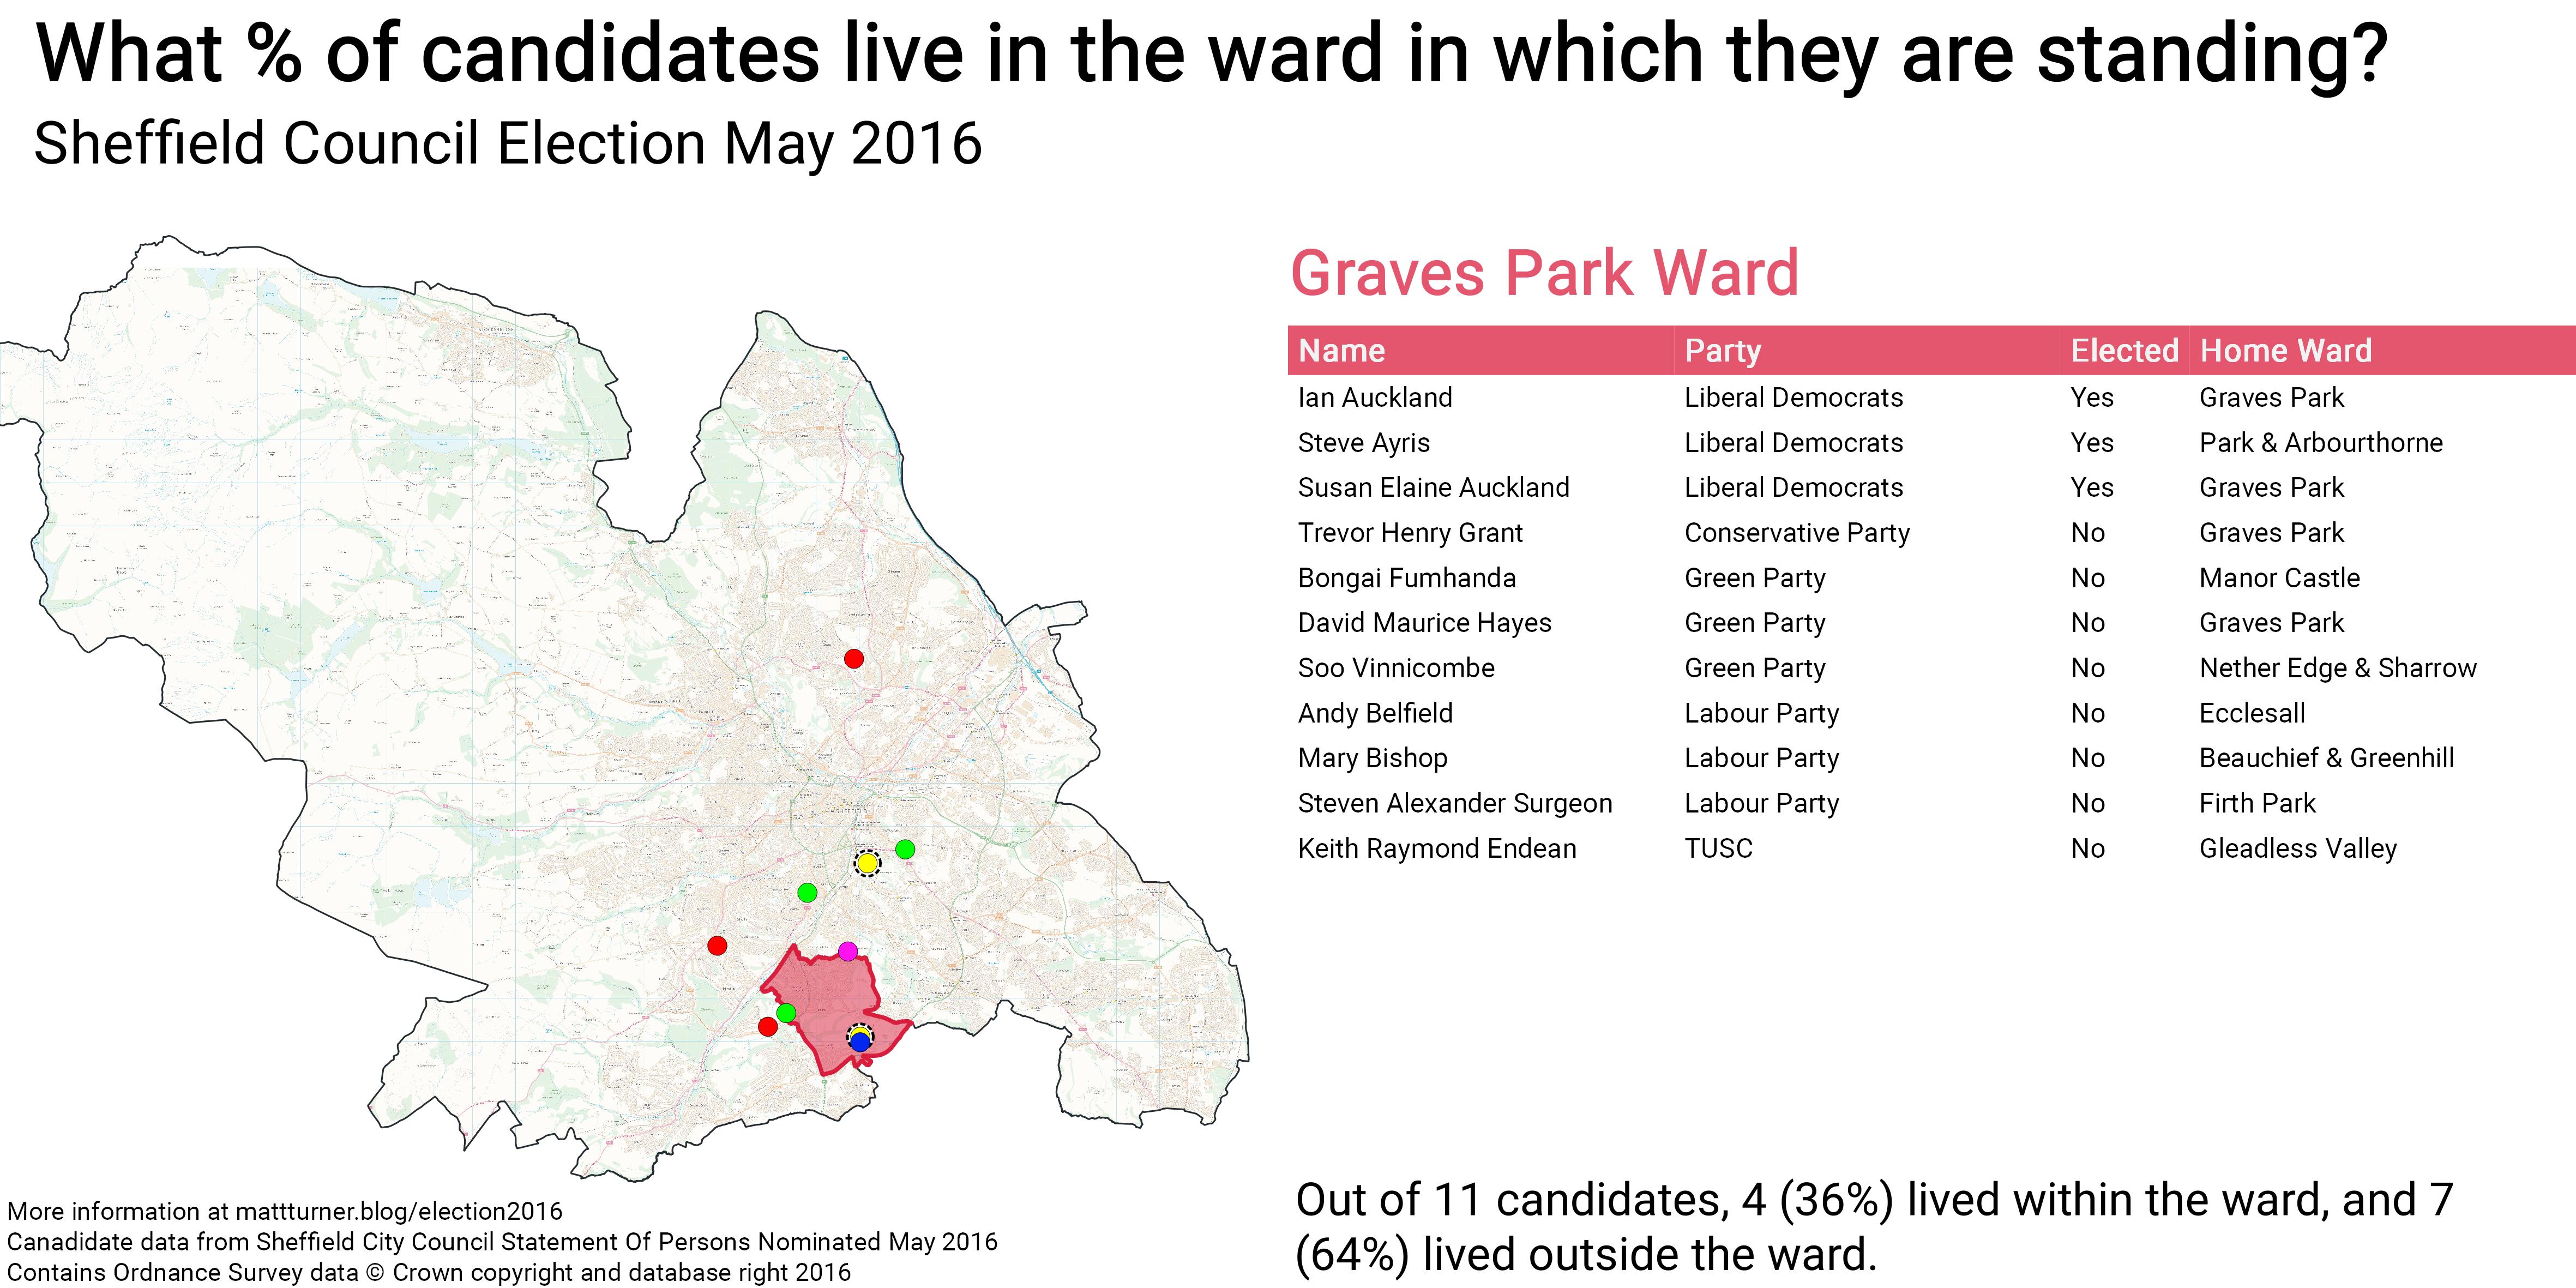
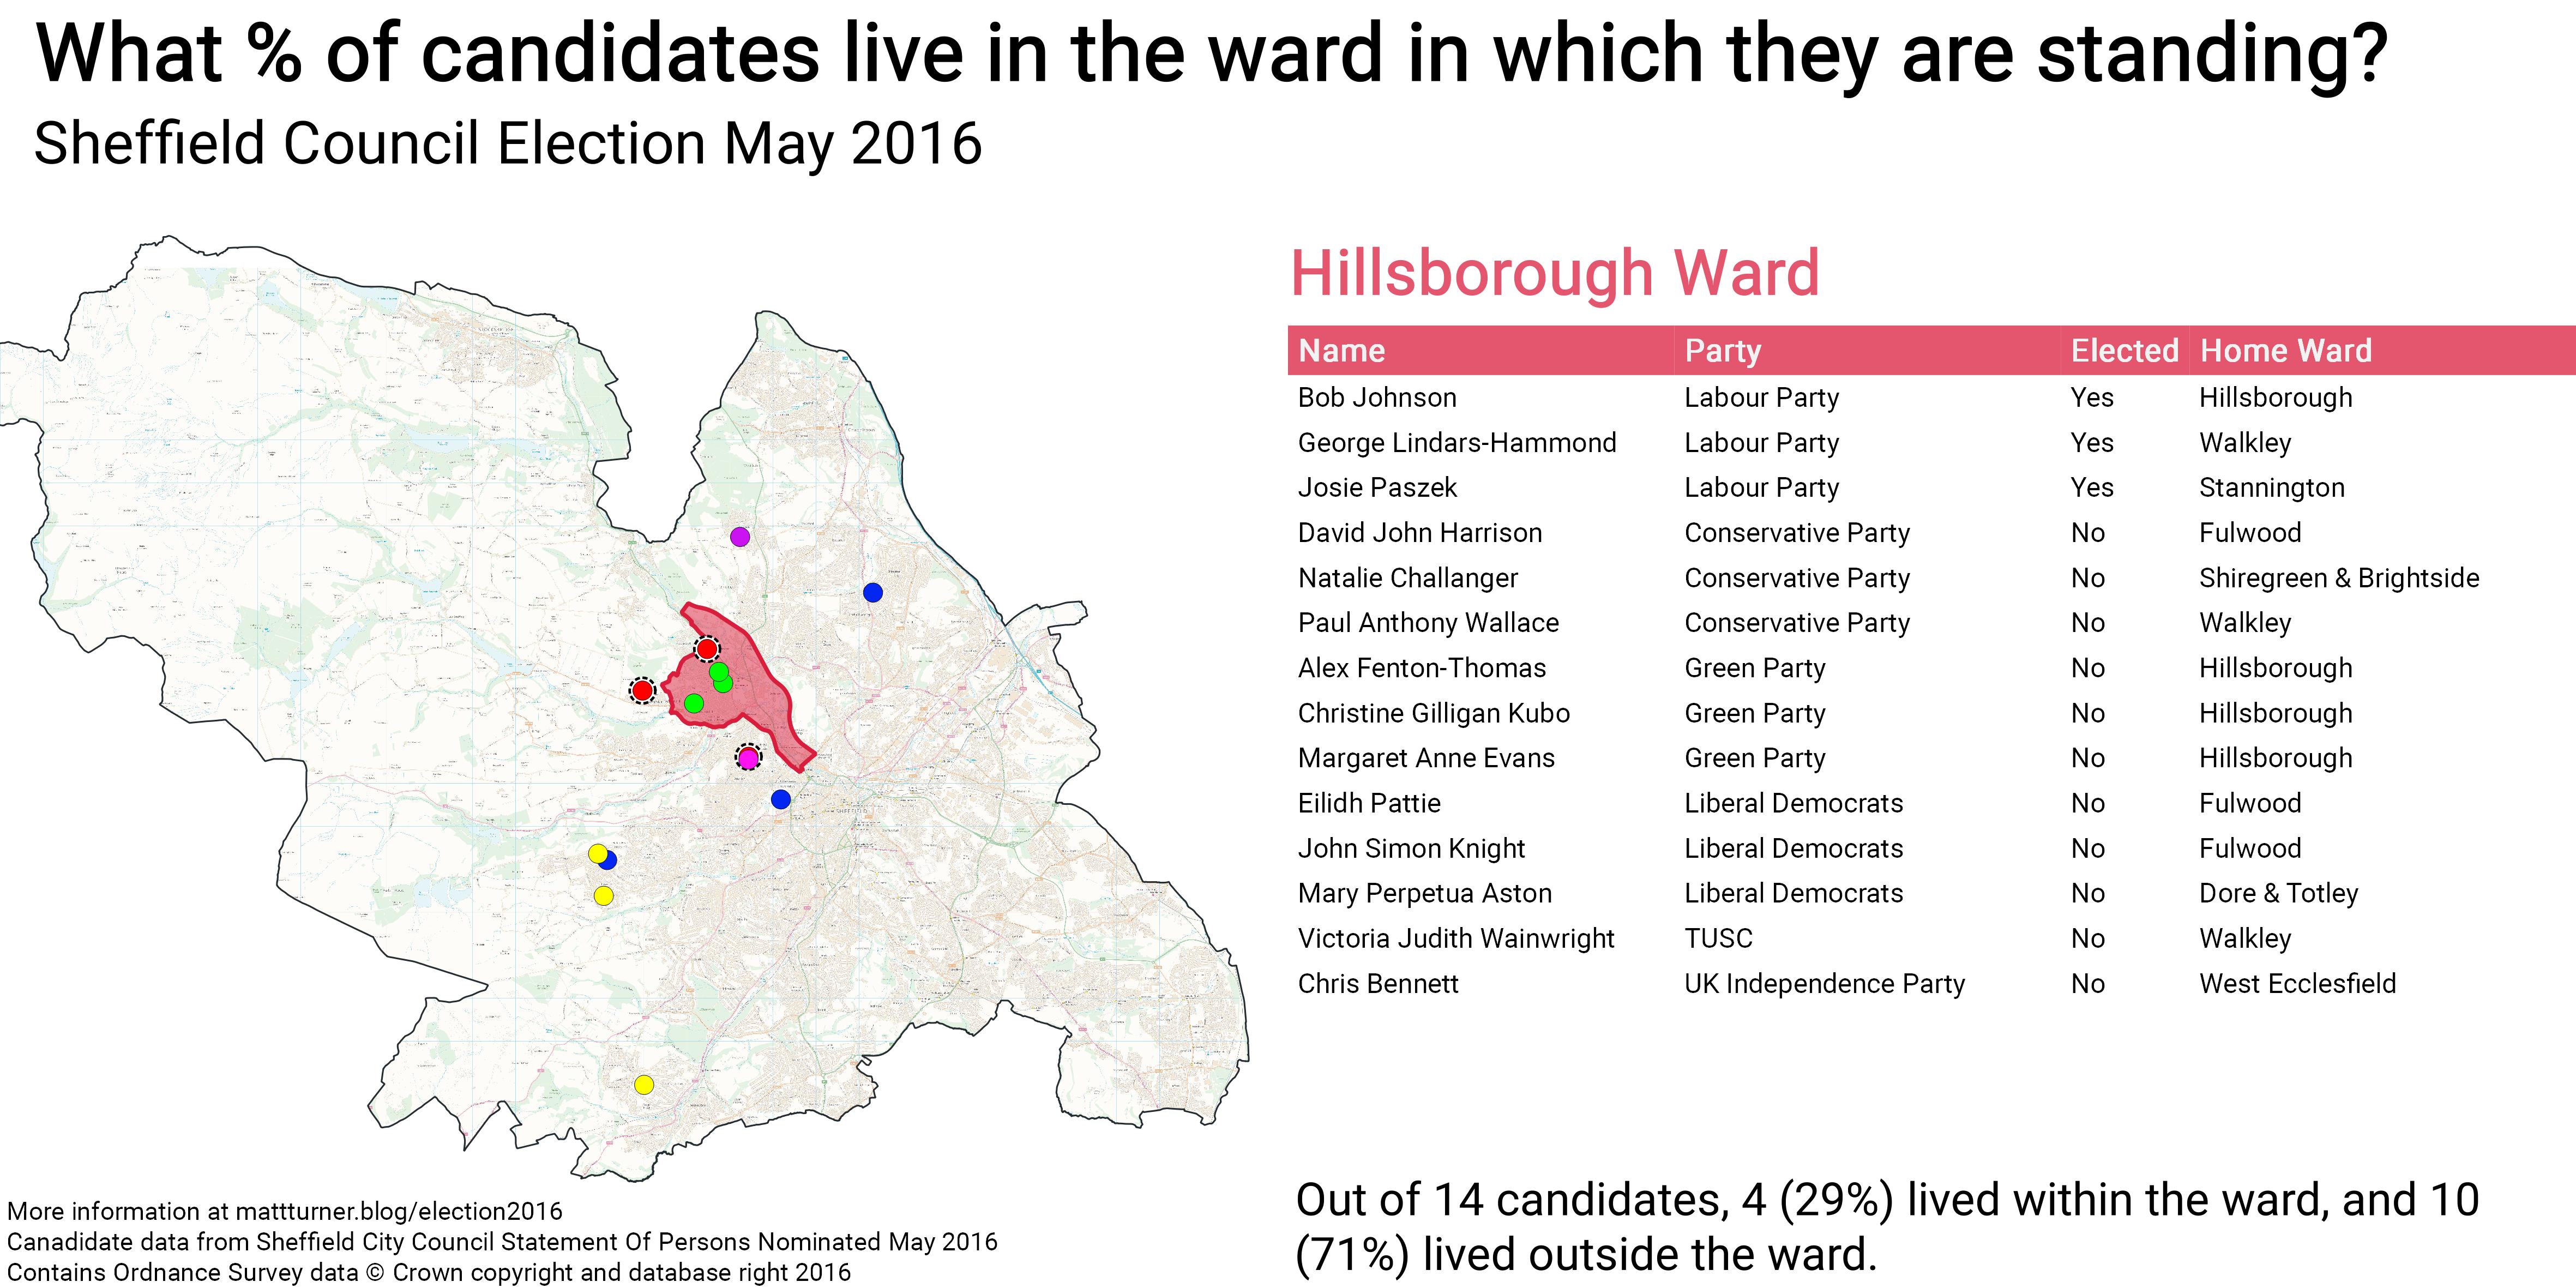
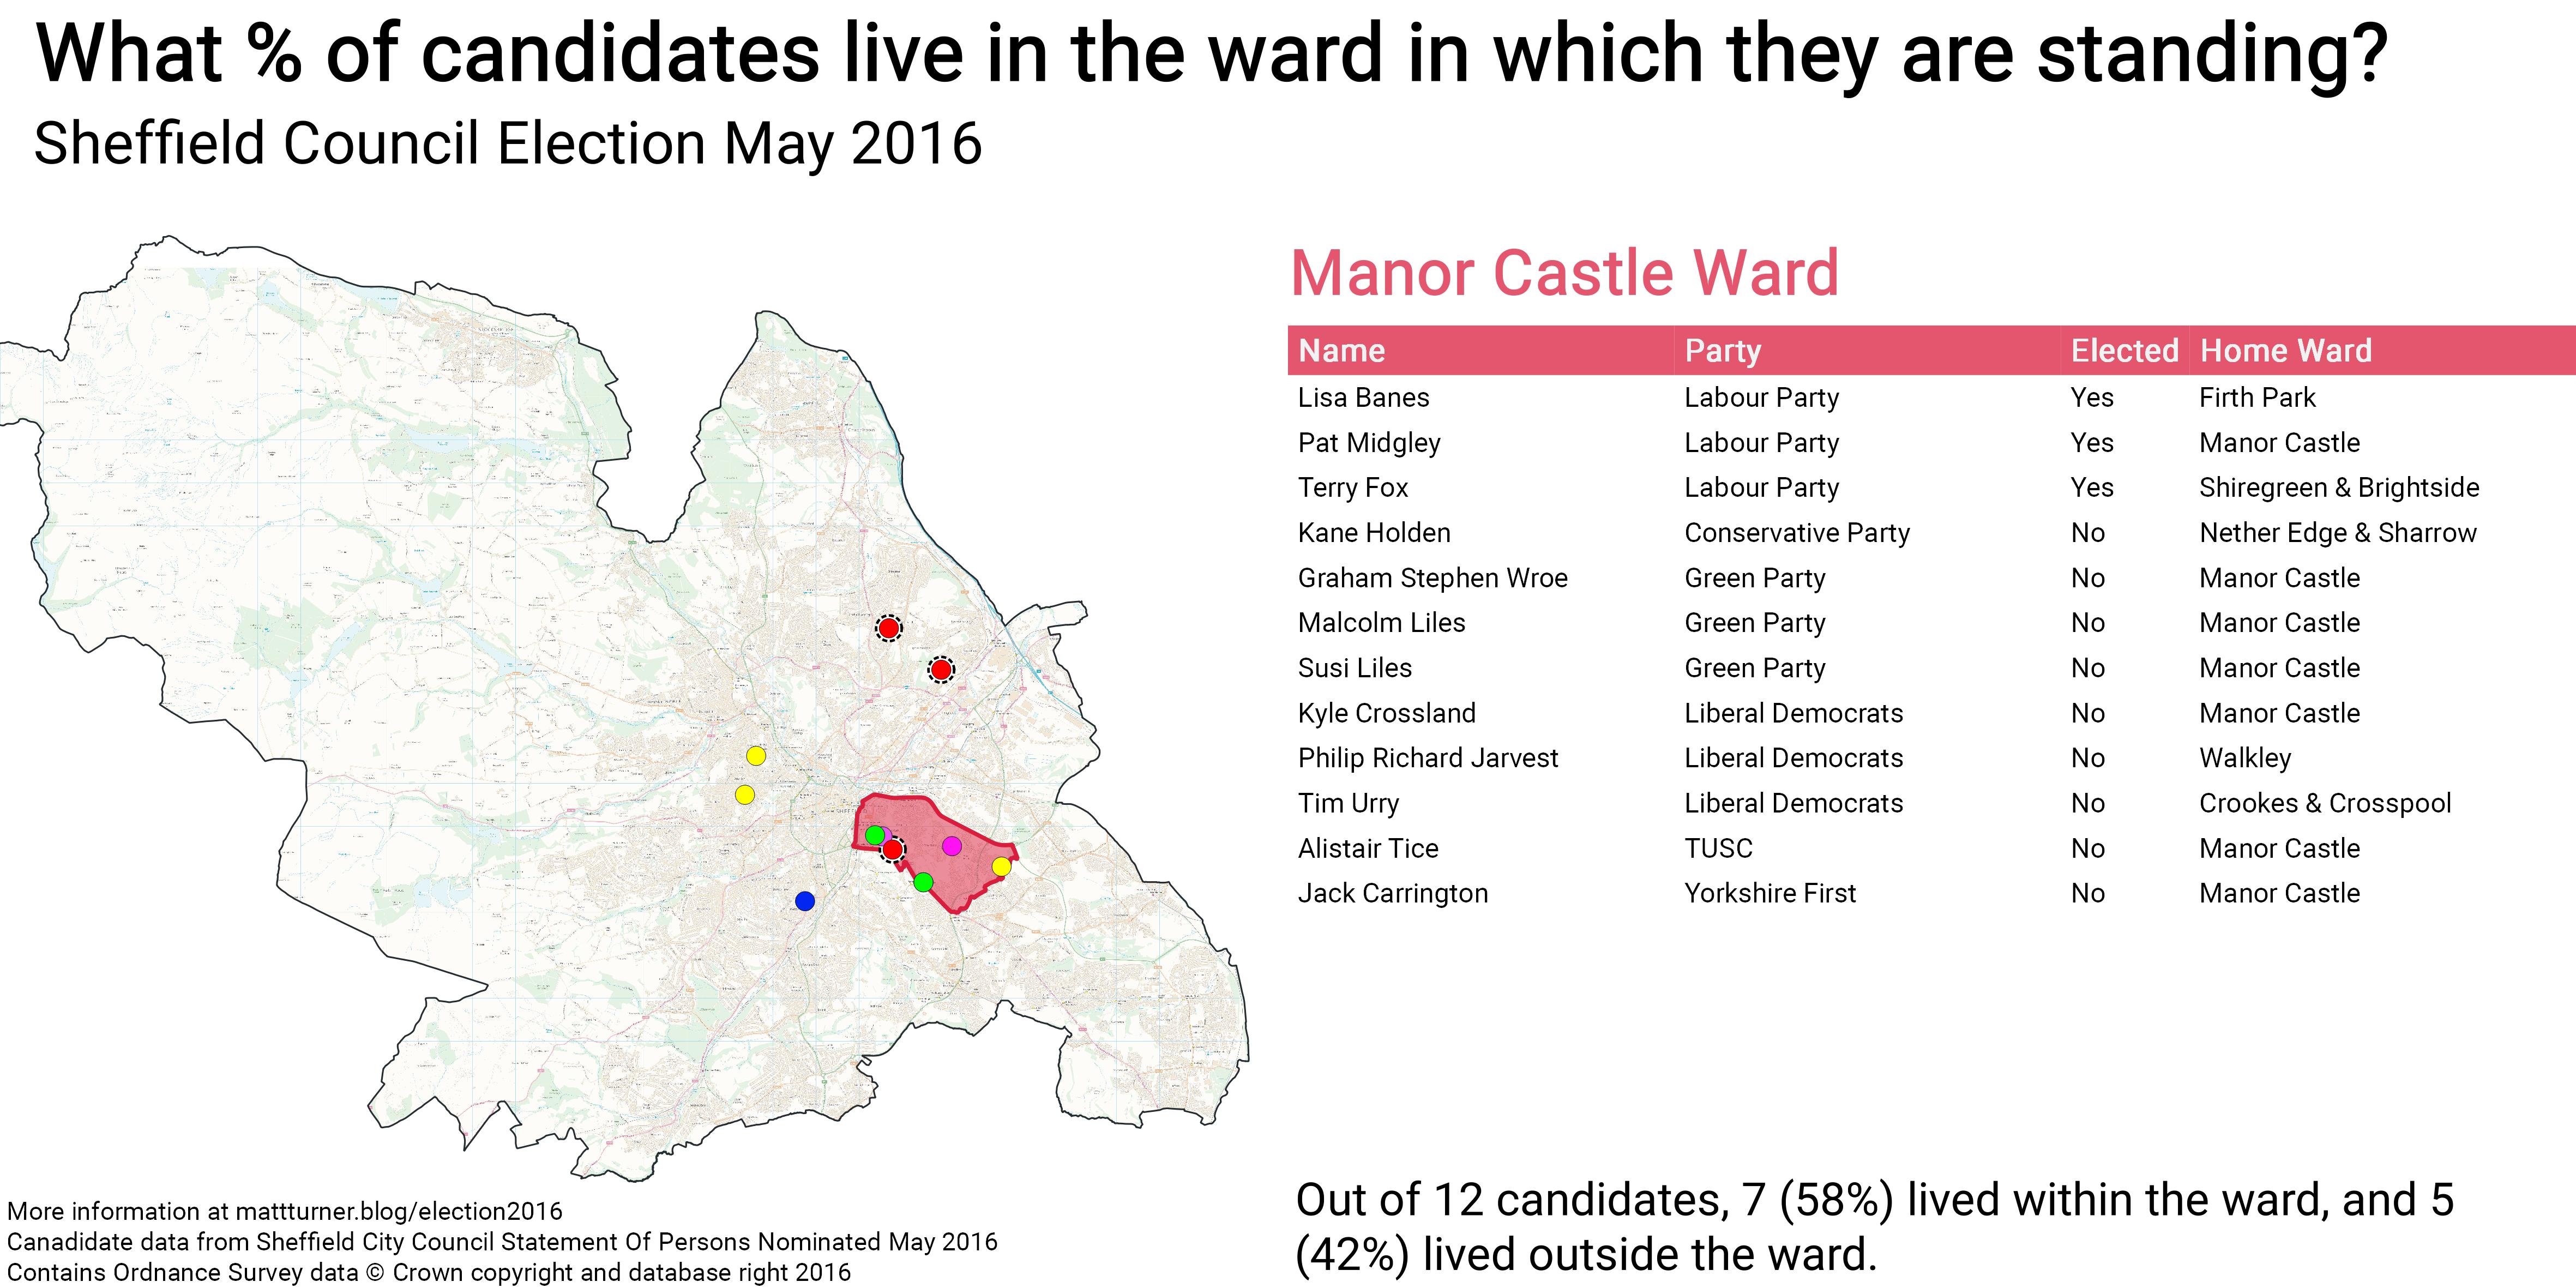
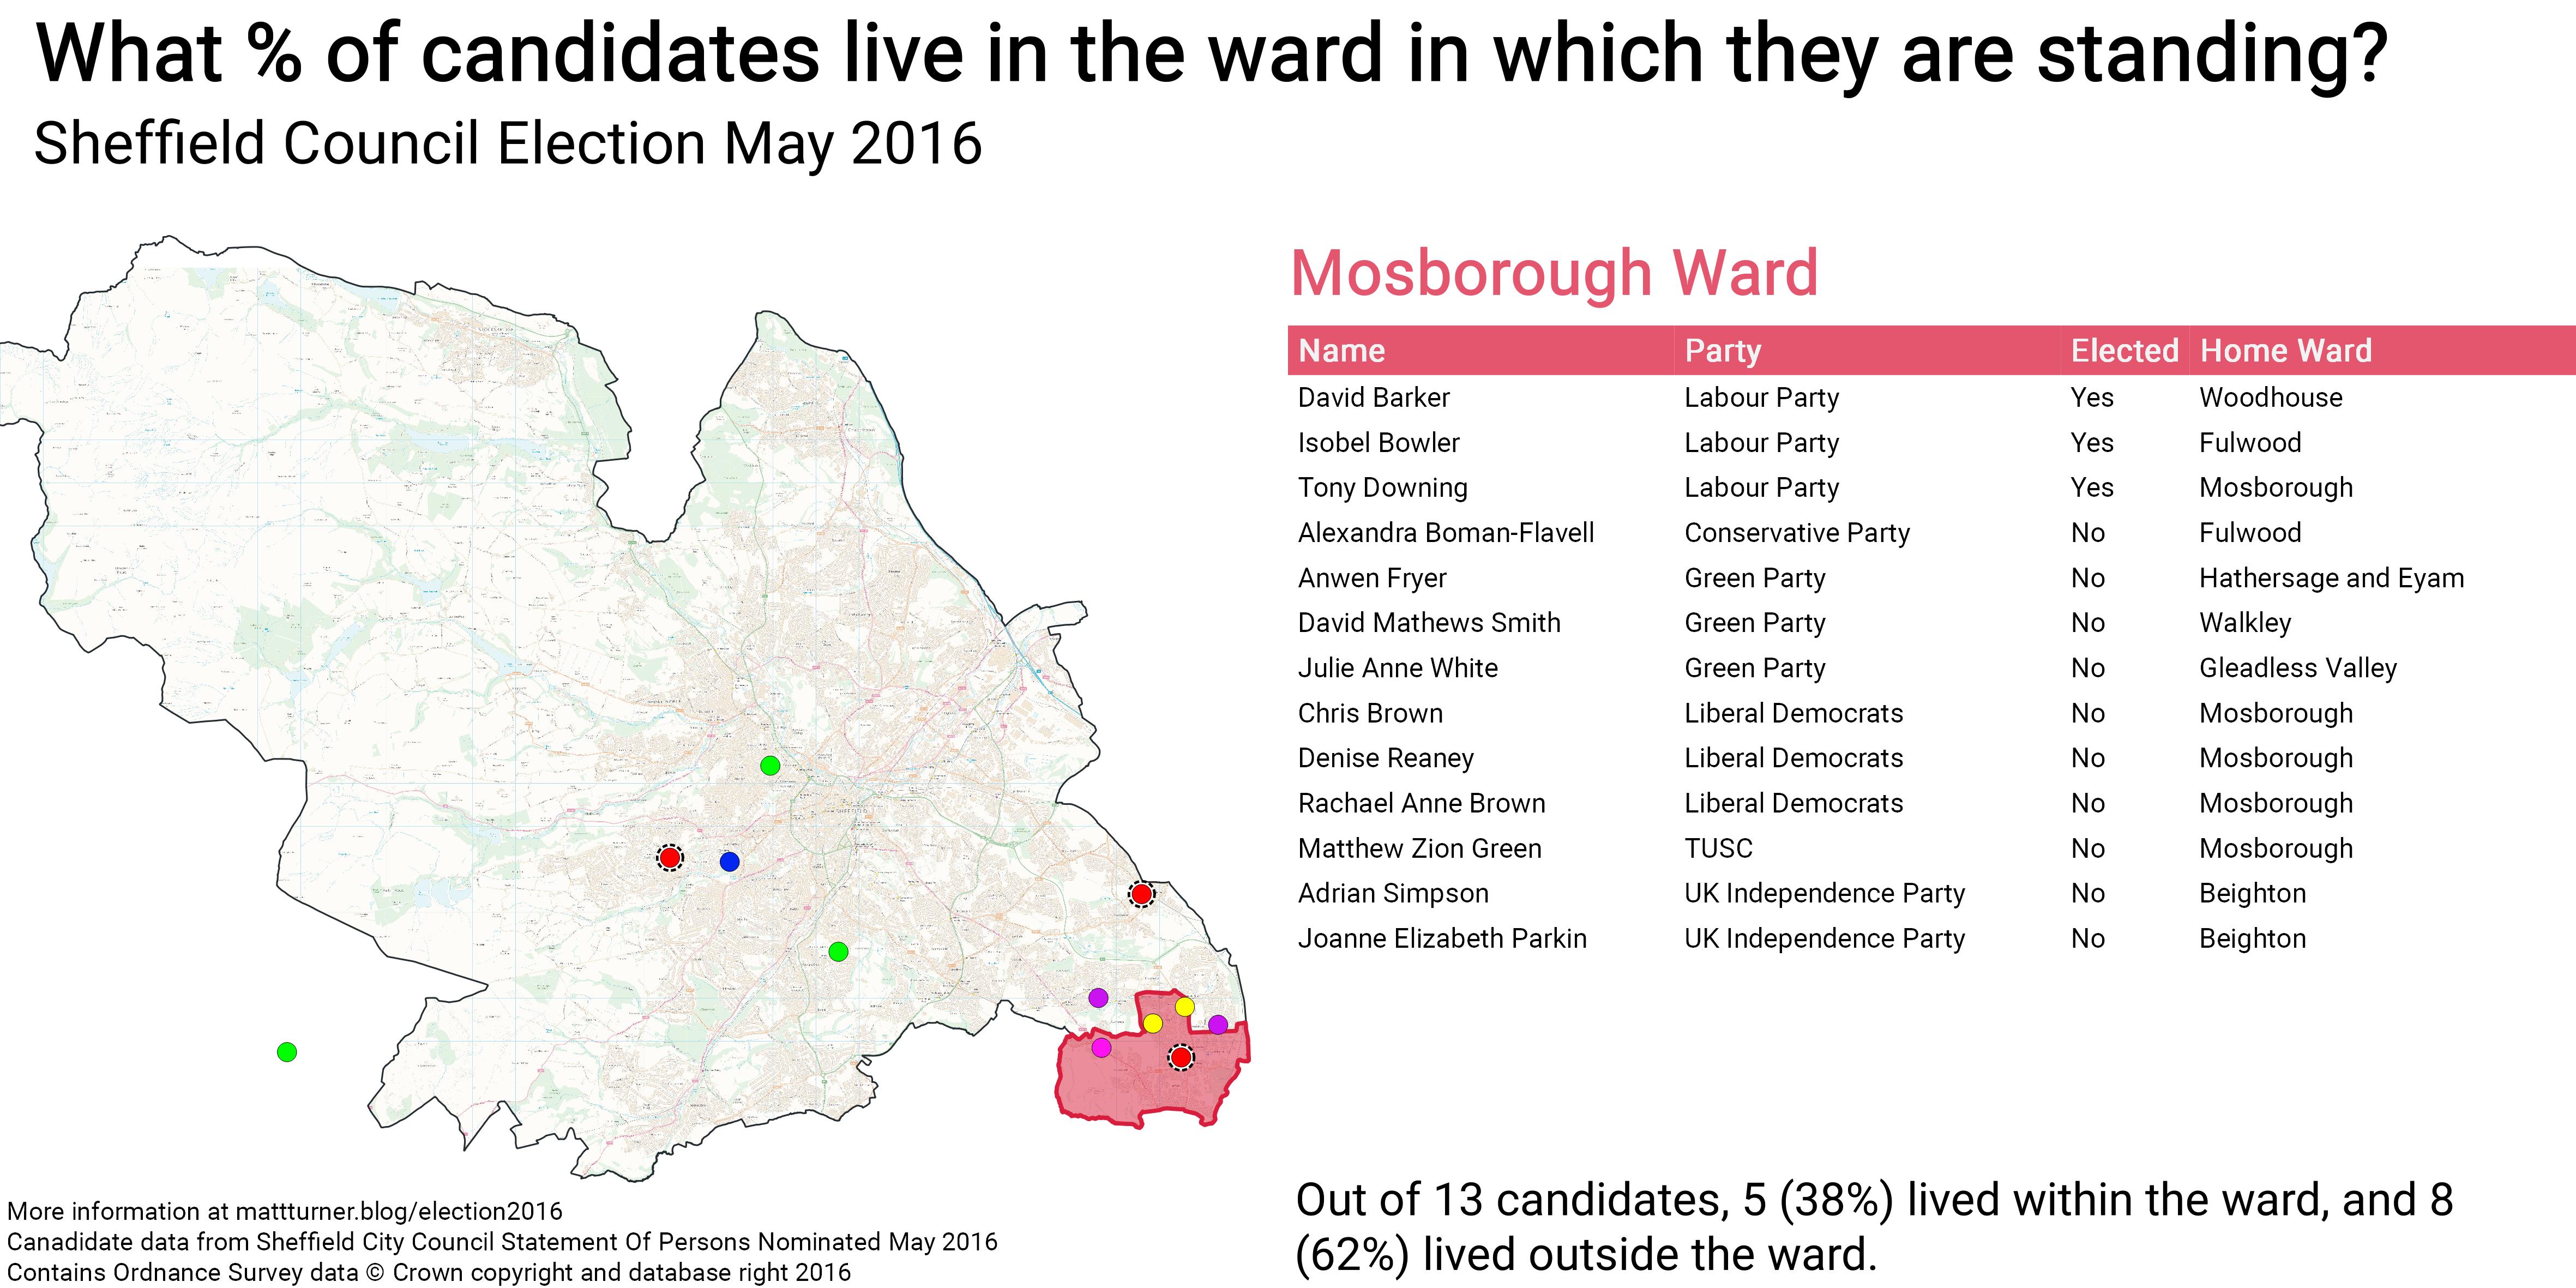
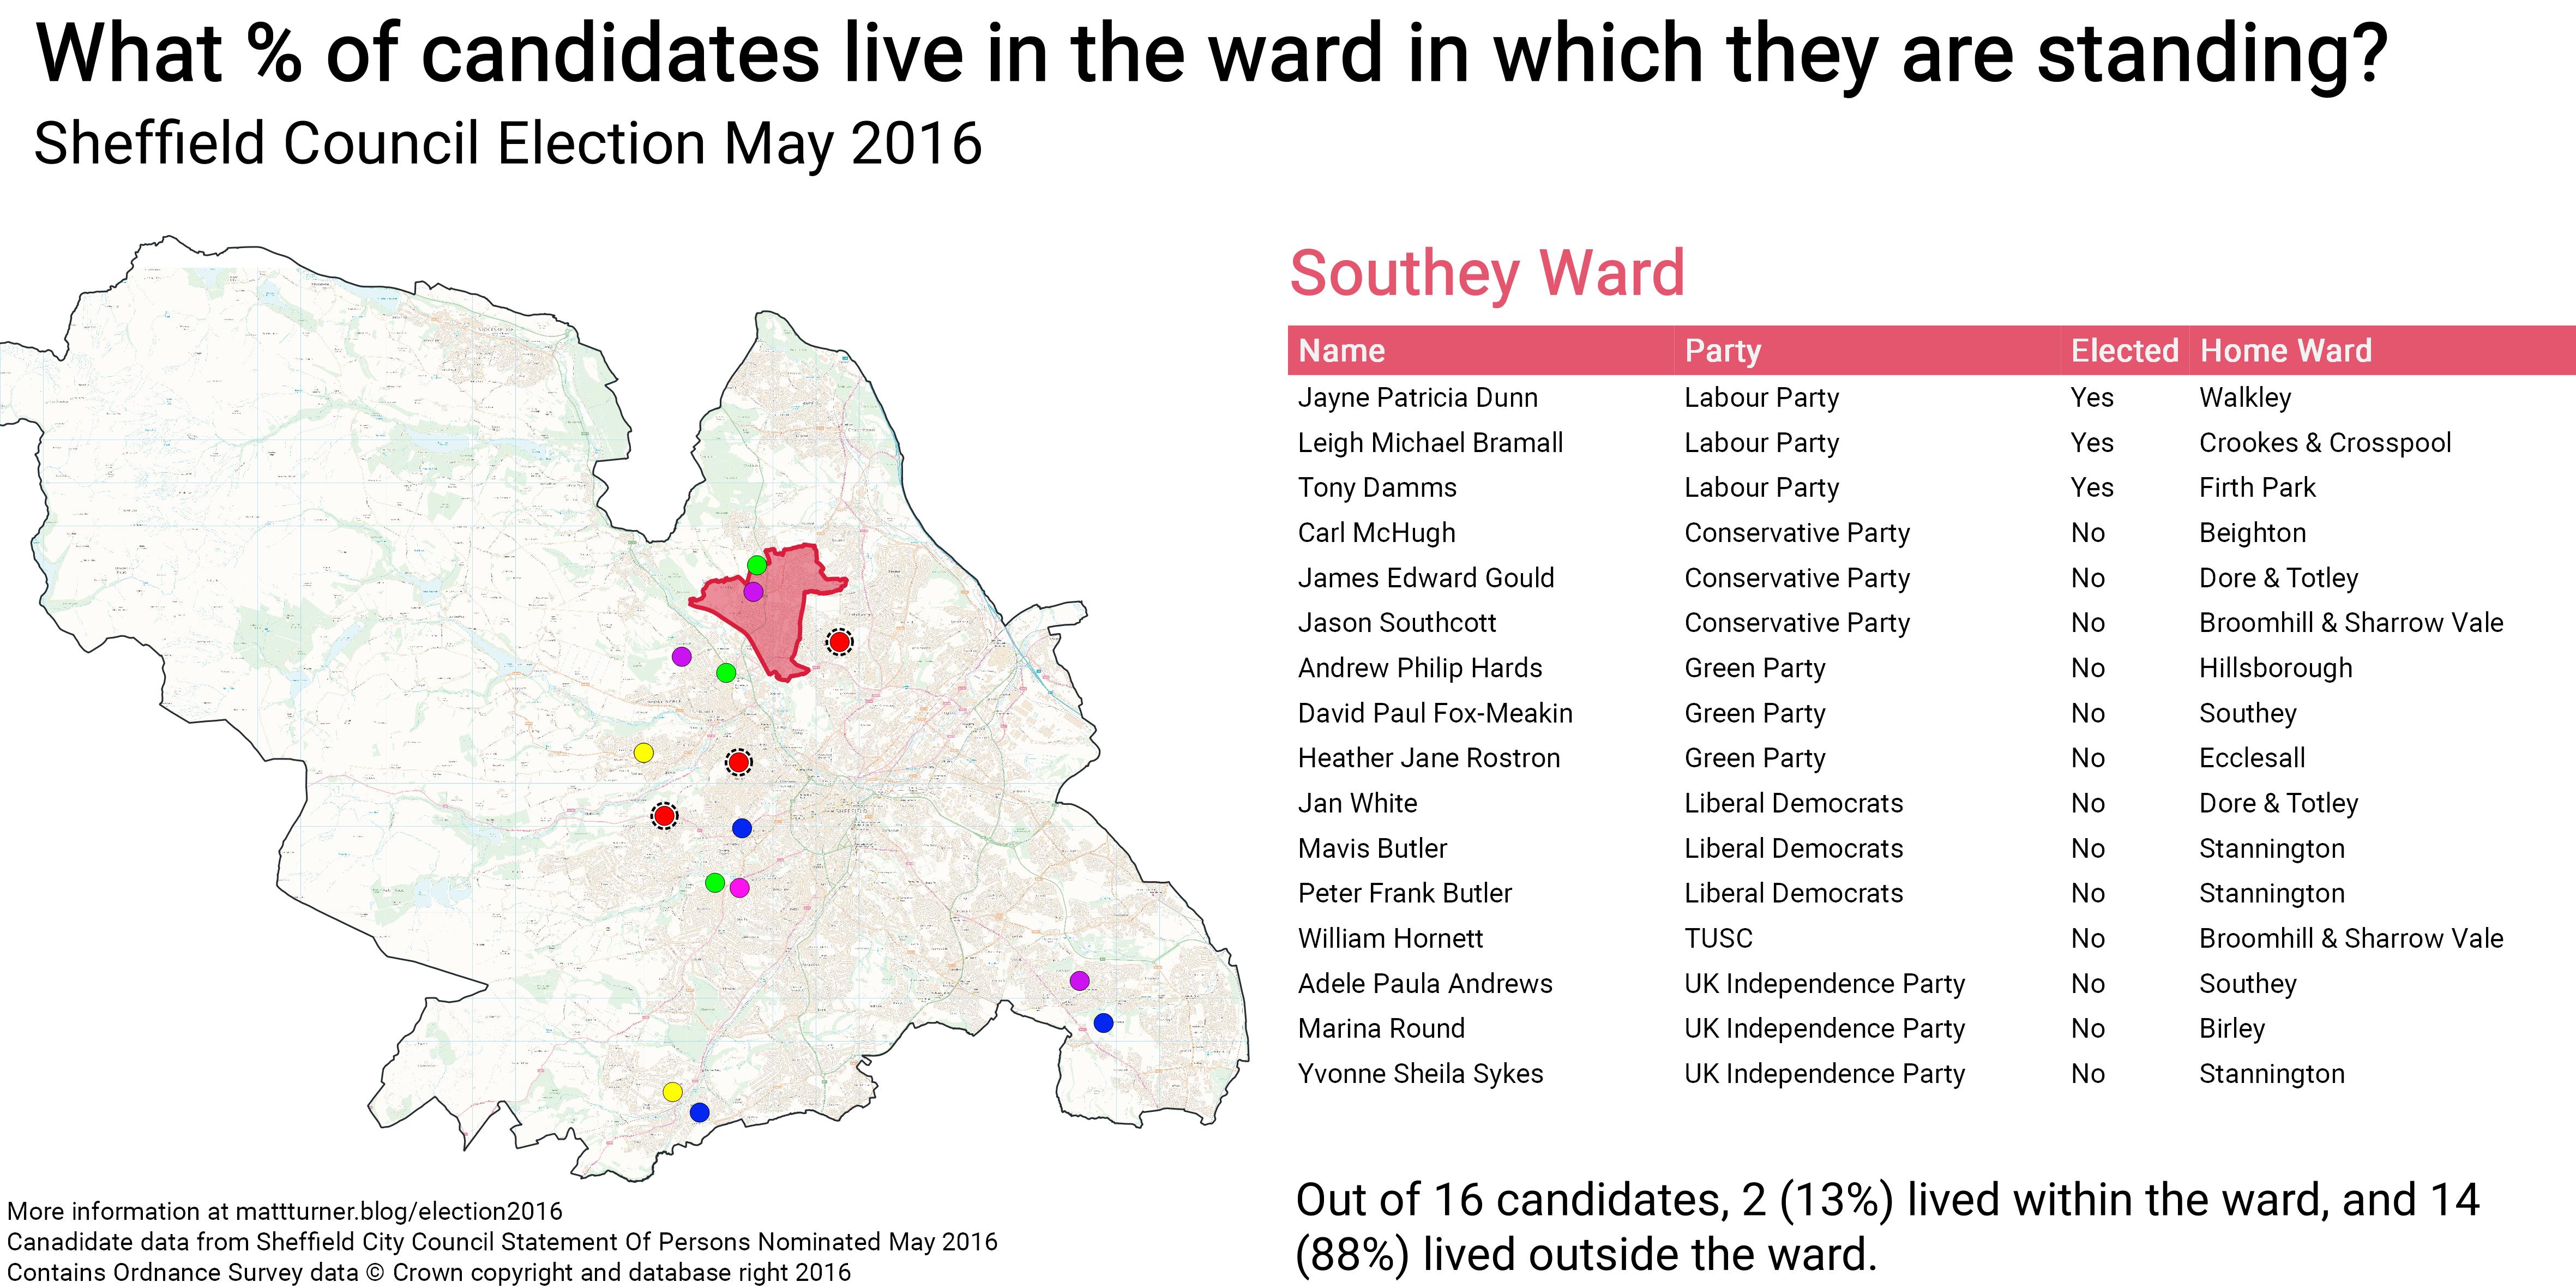
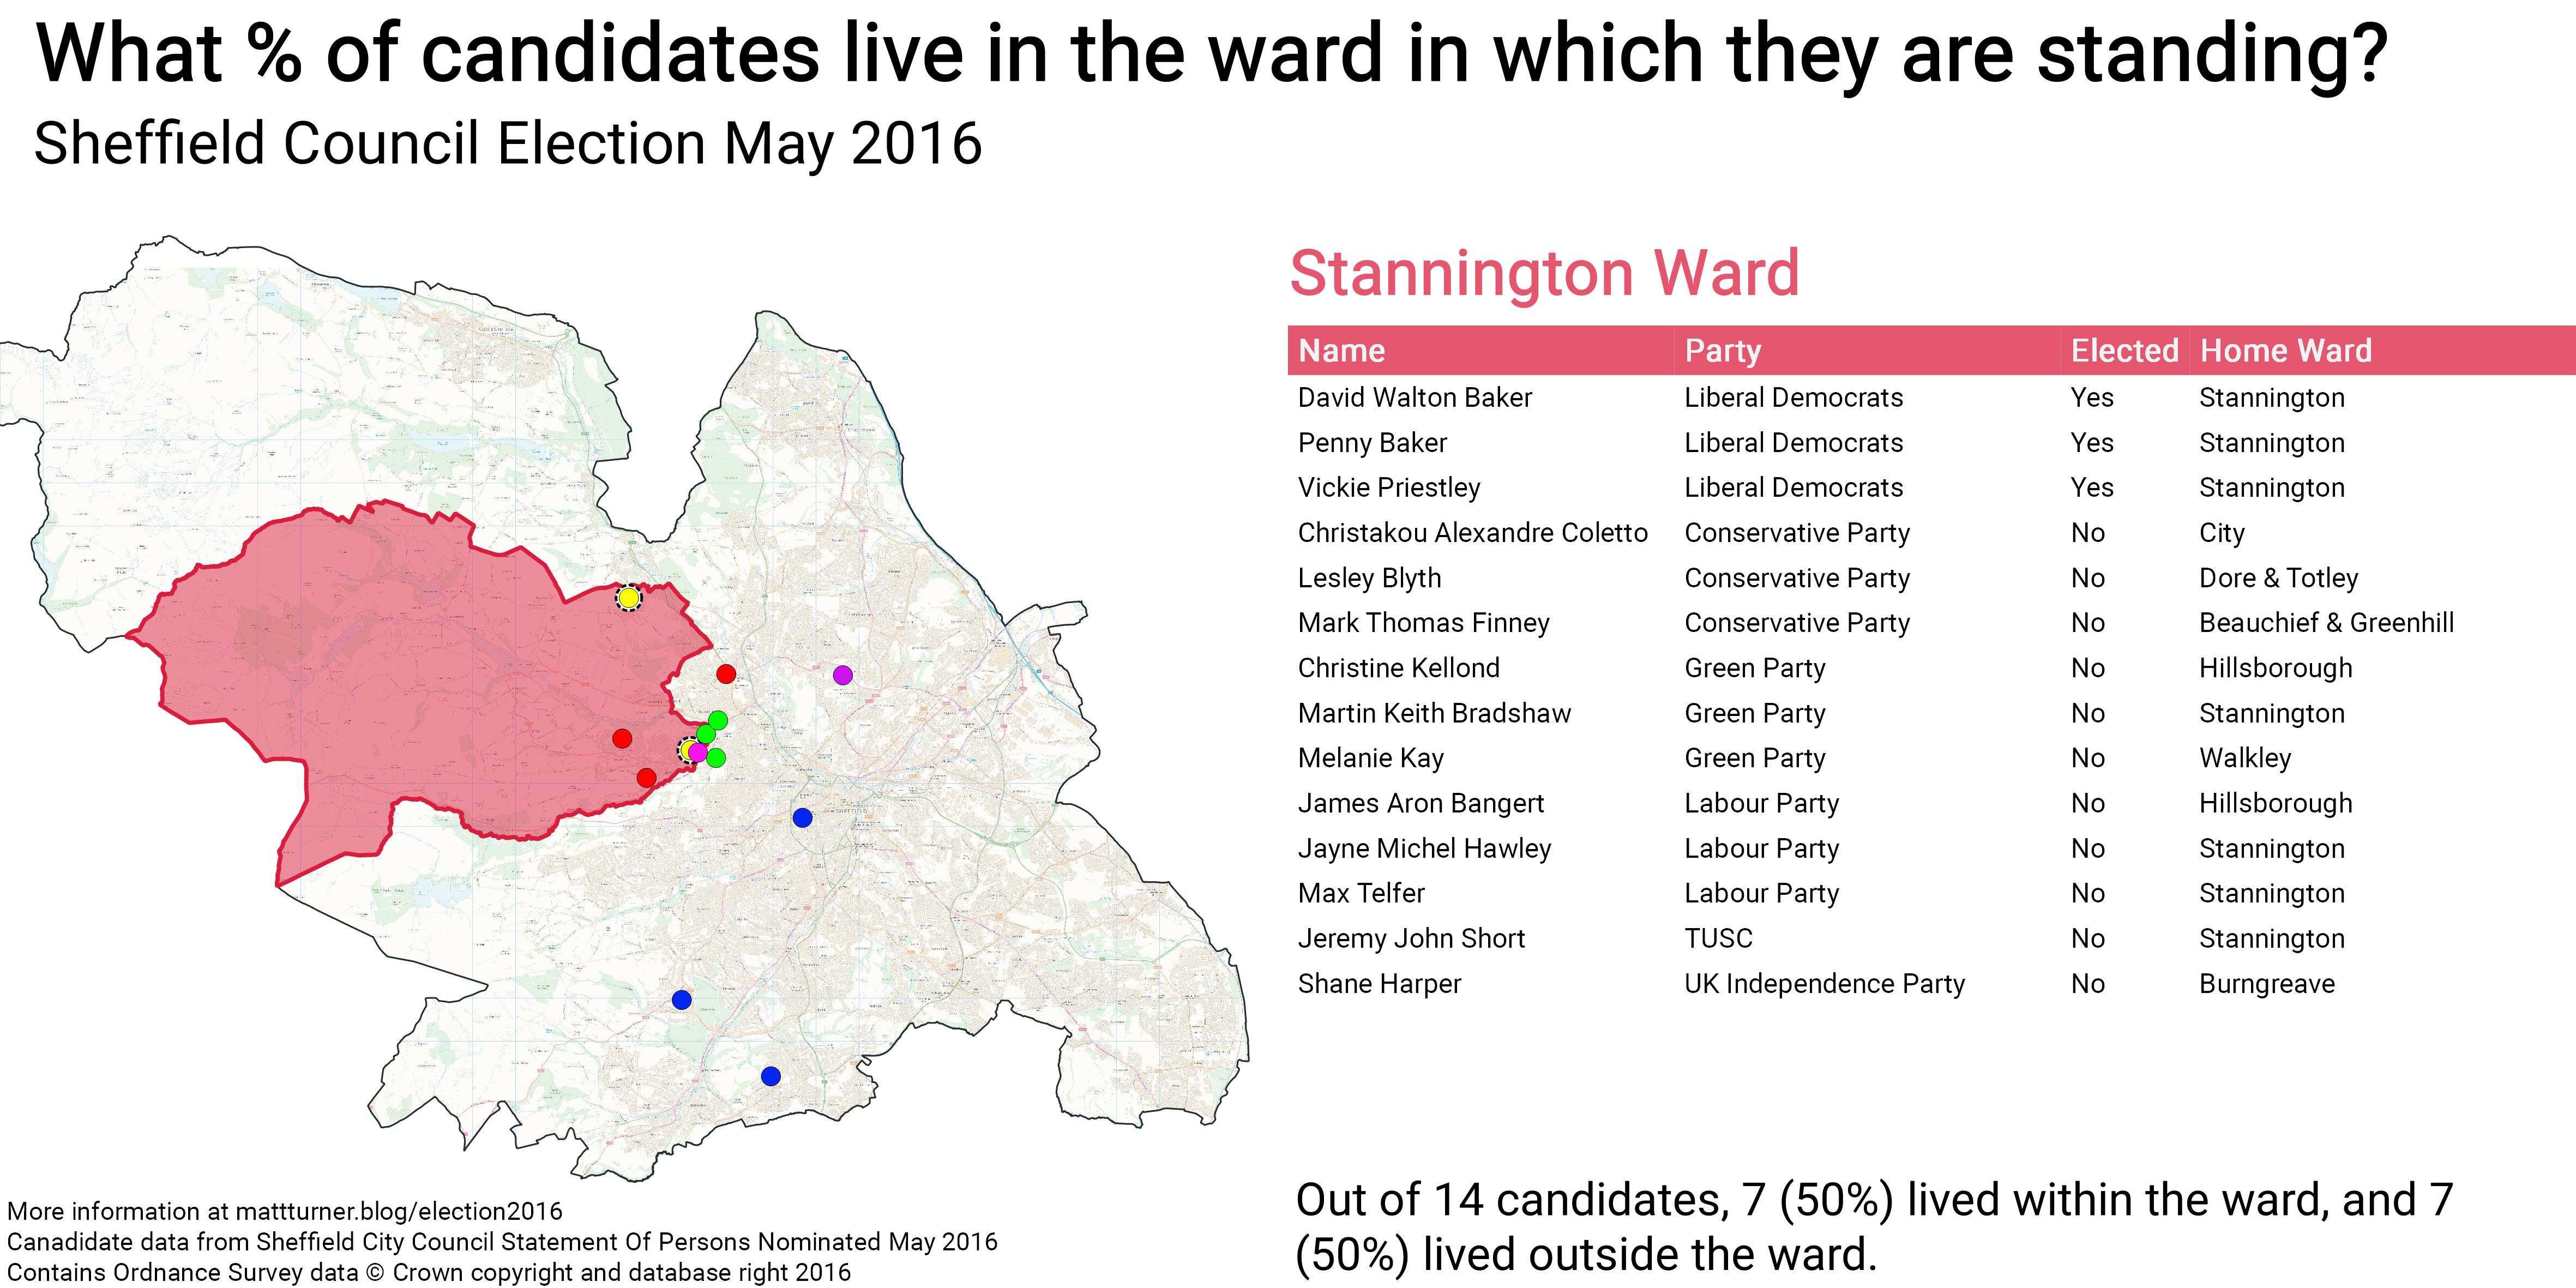
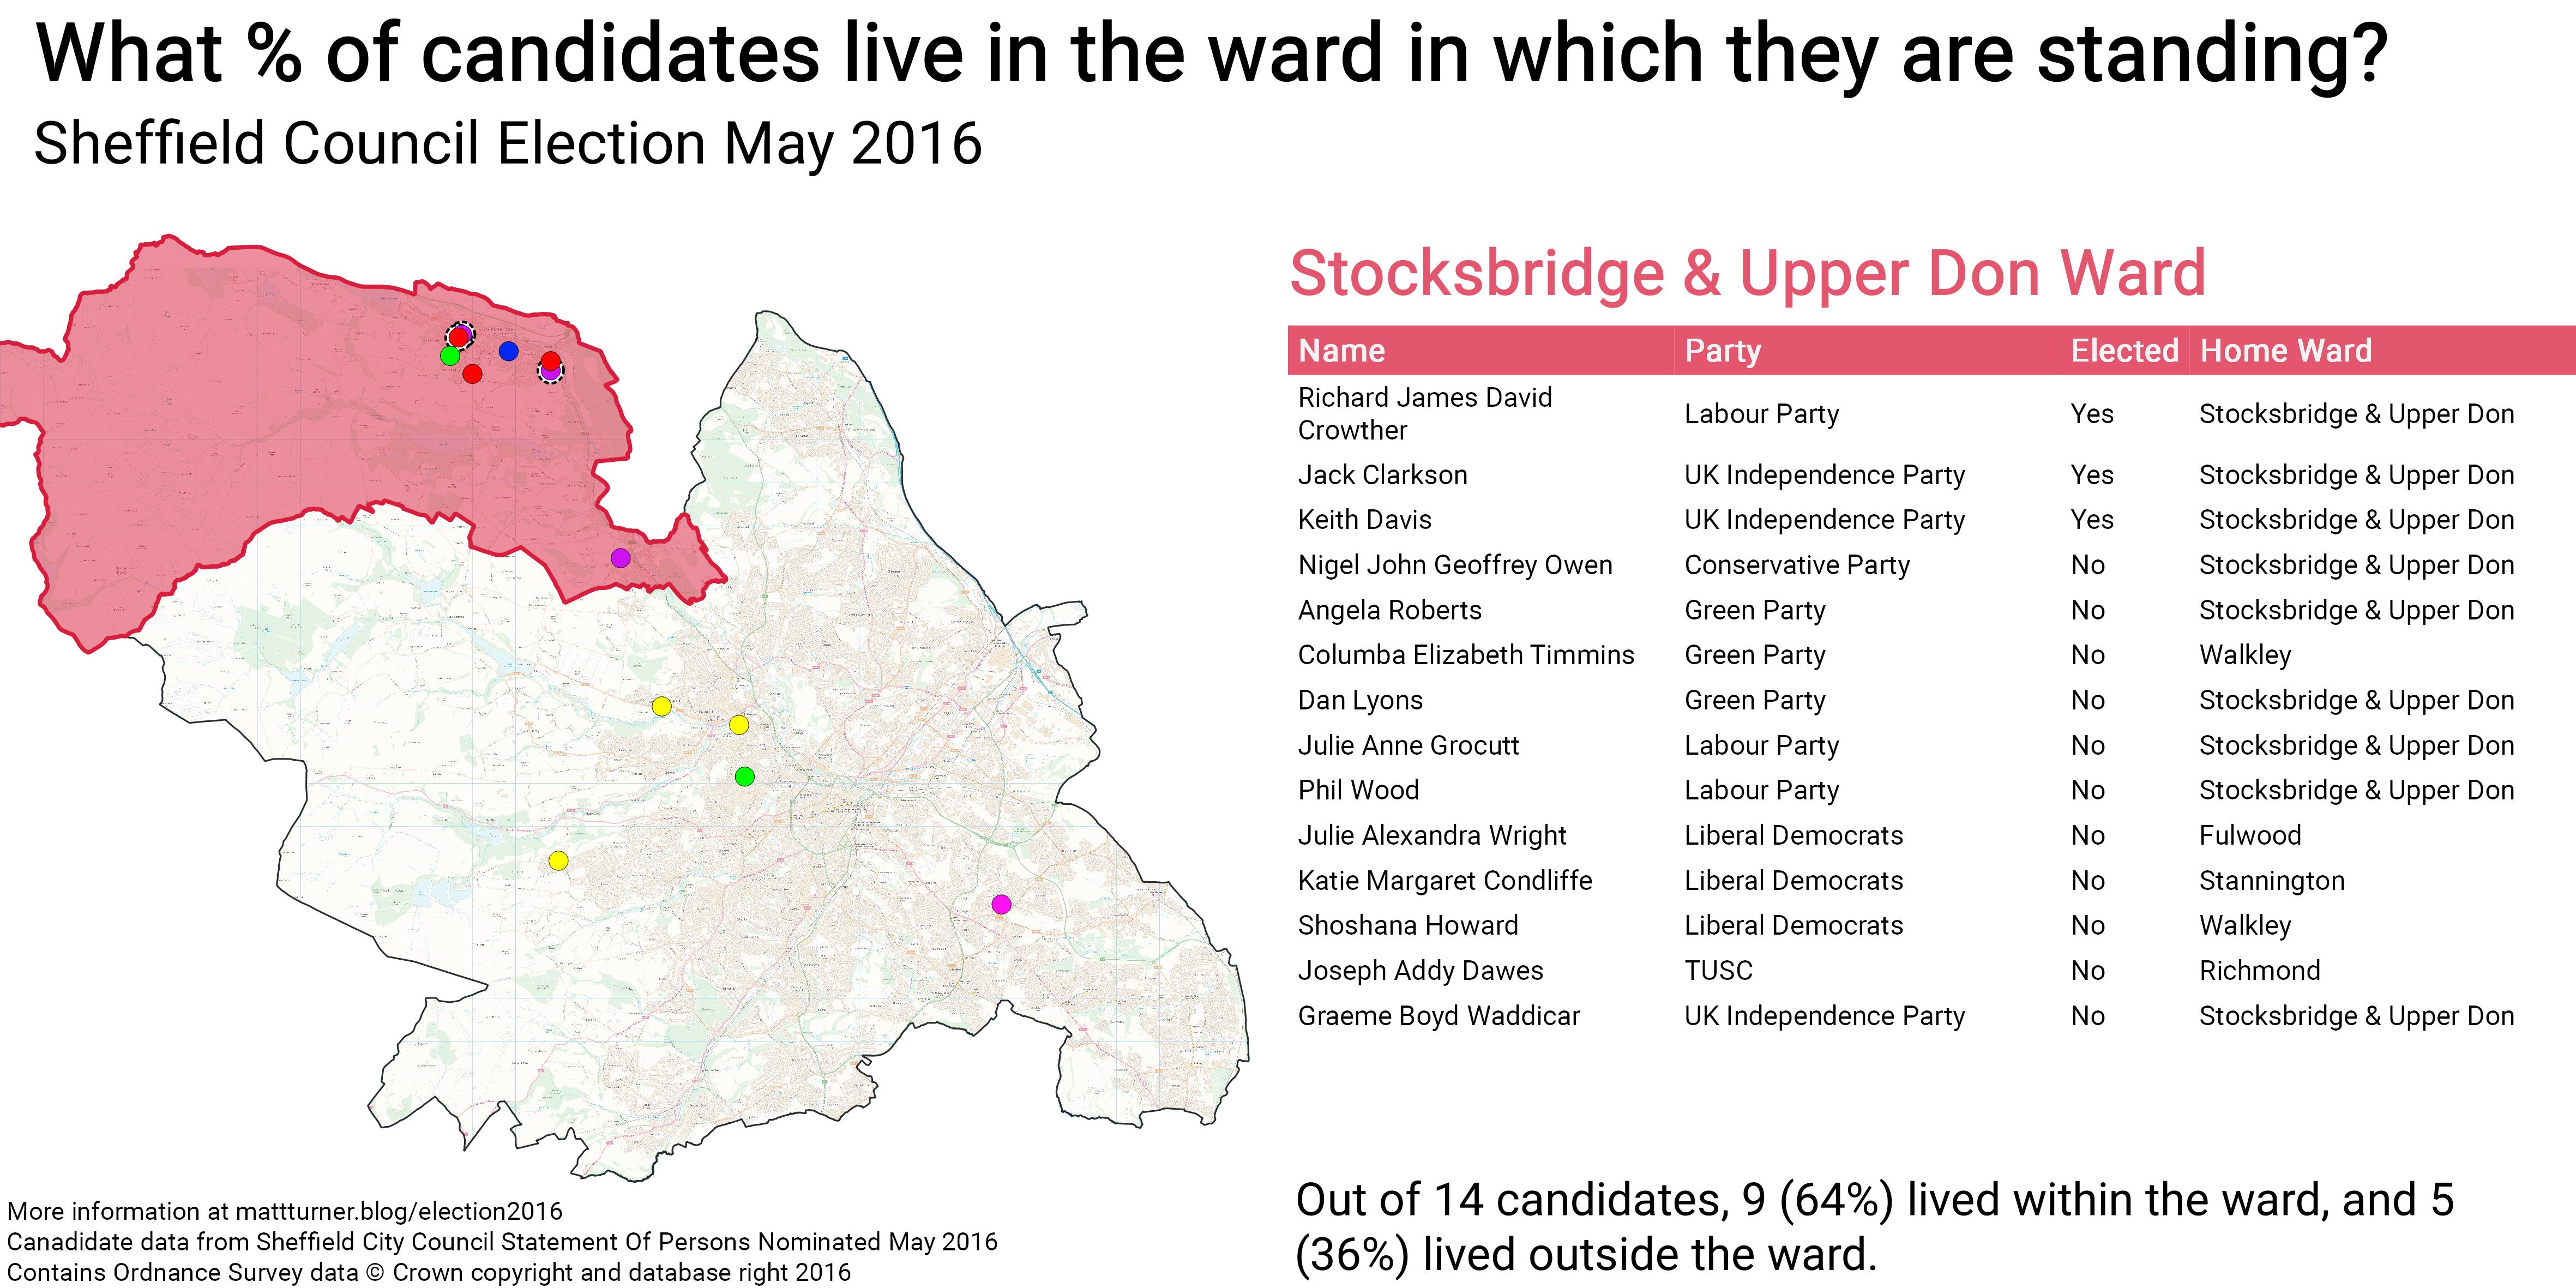
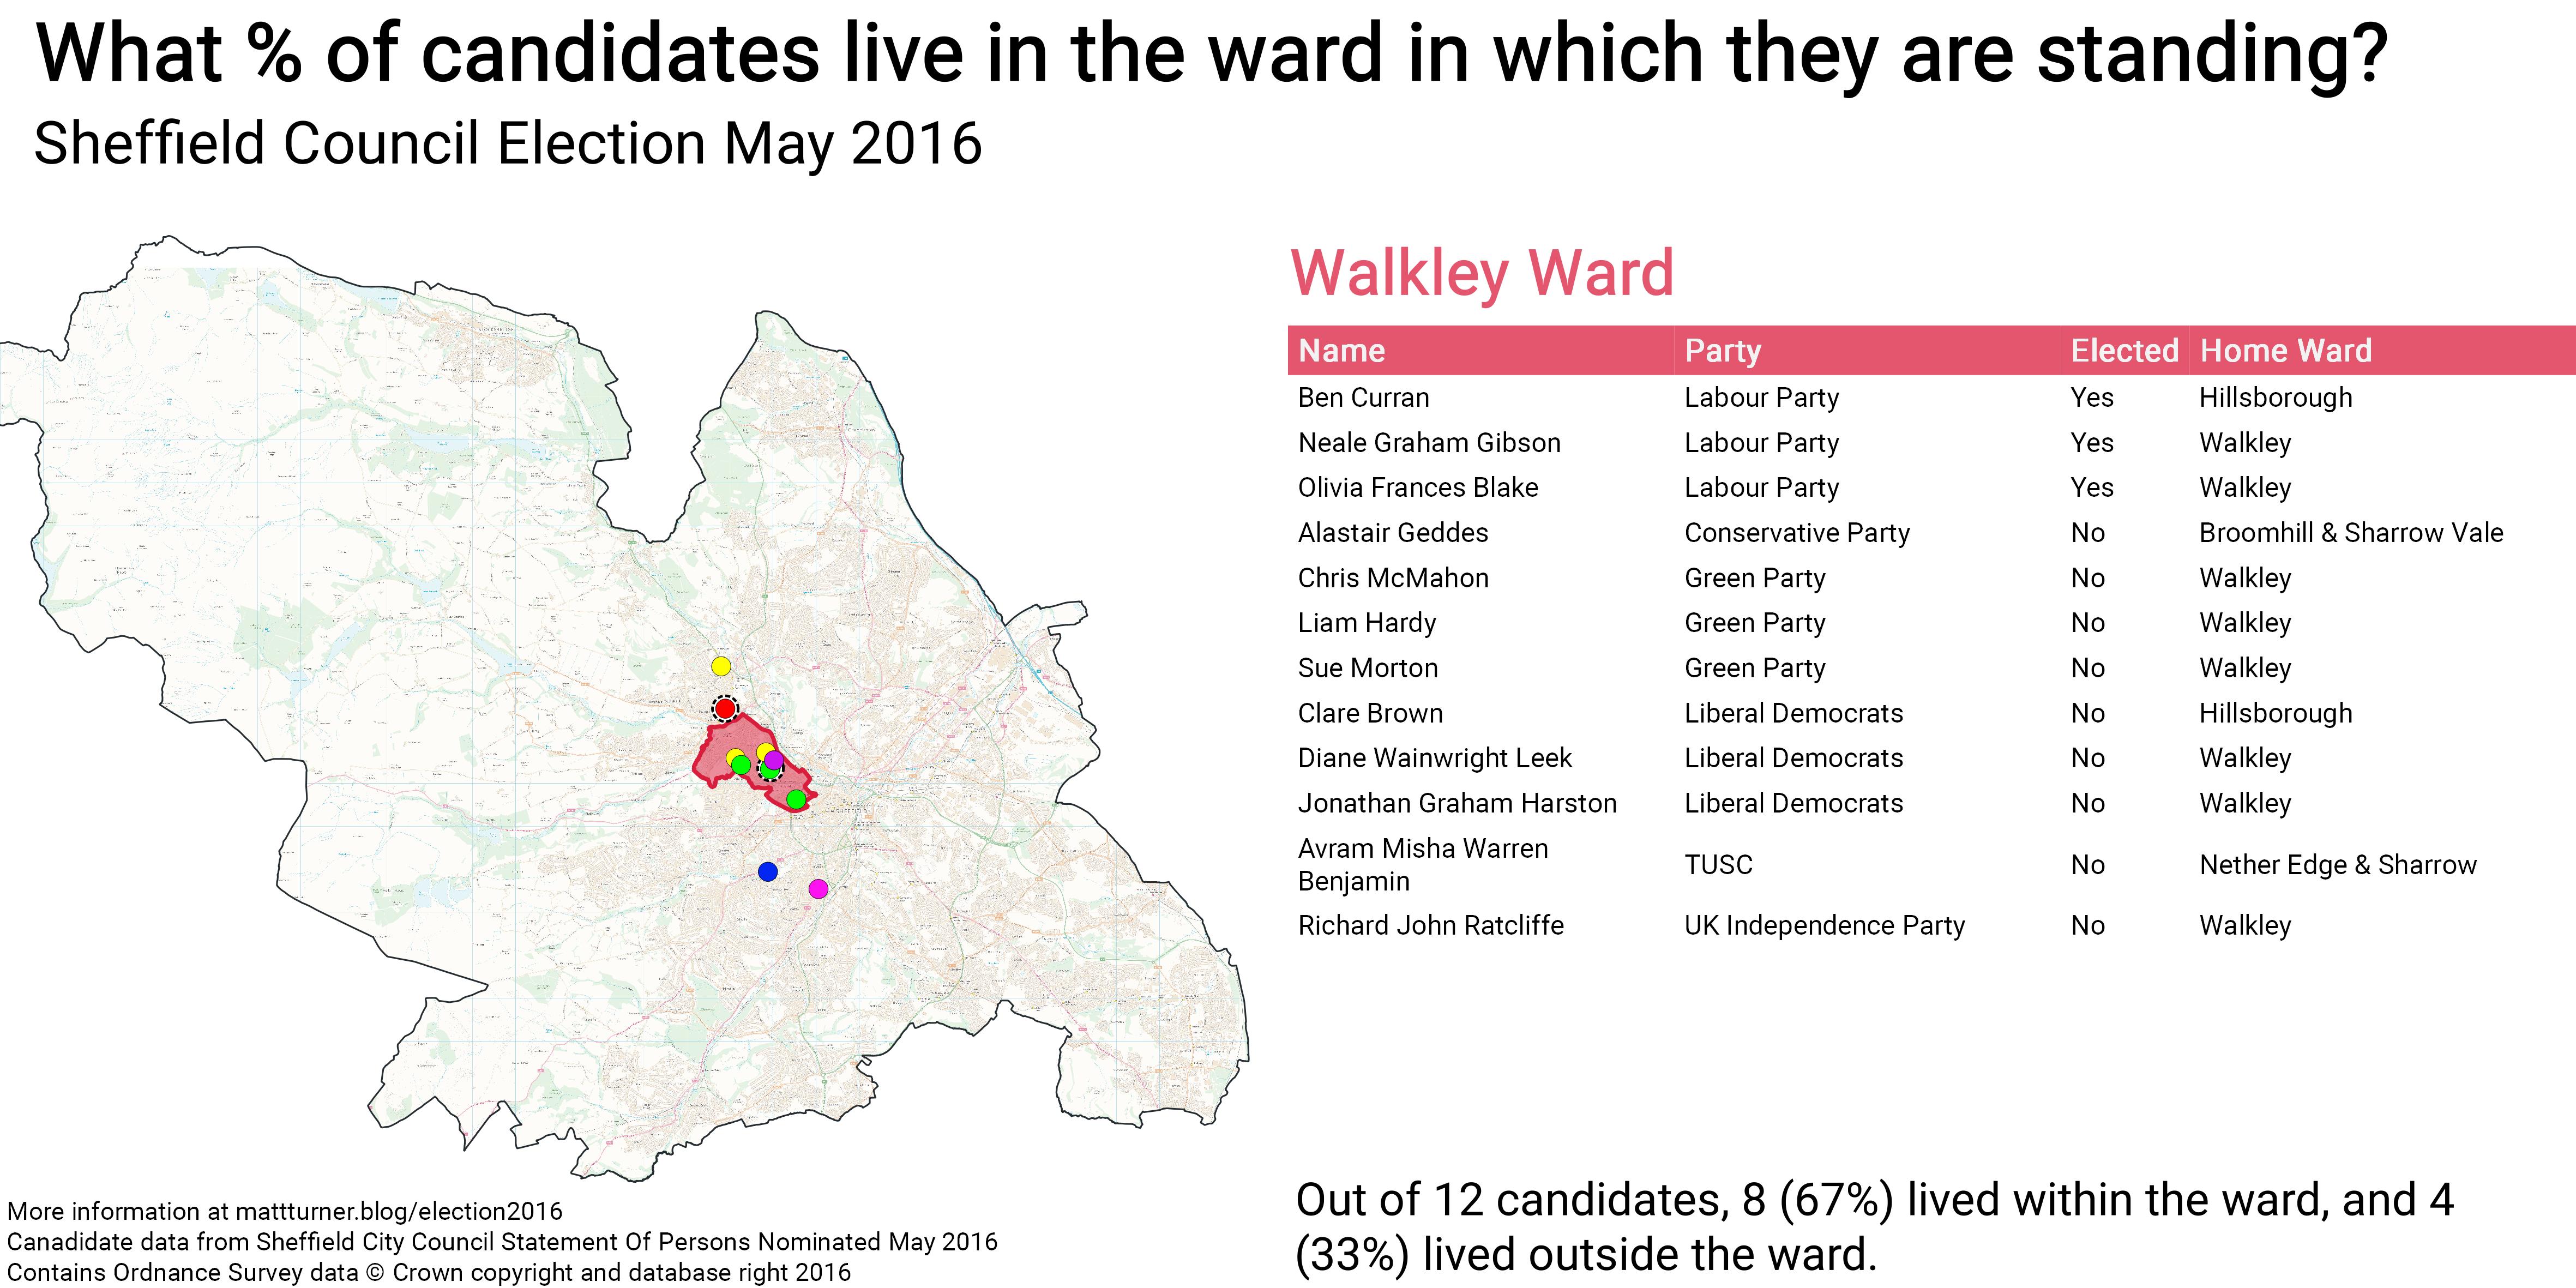
This varied across each ward, with Firth Park, Shregreen & Brightside, Richmond, Park & Arbourthorne Wards each only having one candidate living in the ward. All the way up to East Ecclesfield ward where 10 of the 14 candidates lived in the ward (71%). Ward NameLive in WardDon’t Live in Ward****CandidatesBeauchief & Greenhill Ward427%1173%15Beighton Ward217%1083%12Birley Ward646%754%13Broomhill & Sharrow Vale Ward536%964%14Burngreave Ward754%646%13City Ward436%764%11Crookes & Crosspool Ward321%1179%14Darnall Ward643%857%14Dore & Totley Ward754%646%13East Ecclesfield Ward1071%429%14Ecclesall Ward750%750%14Firth Park Ward17%1493%15Fulwood Ward429%1071%14Gleadless Valley Ward542%758%12Graves Park Ward436%764%11Hillsborough Ward429%1071%14Manor Castle Ward758%542%12Mosborough Ward538%862%13Nether Edge & Sharrow Ward538%862%13Park & Arbourthorne Ward18%1192%12Richmond Ward18%1292%13Shiregreen & Brightside Ward17%1393%14Southey Ward213%1488%16Stannington Ward750%750%14Stocksbridge & Upper Don Ward964%536%14Walkley Ward867%433%12West Ecclesfield Ward754%646%13Woodhouse Ward323%1077%13_Grand Total__135__36%__237__64%_372 Some wards were home to a significant number of candidates. Walkley and ‘Dore and Totley’ wards were each home to 27 candidates, some parts of the city are home to many more political candidates than others.
Interestingly, 8 candidates lived in Firth Park Ward, even though 13 of the 14 candidates standing in that ward lived outside the area. Ward Name****Number of candidates for any council seat in Sheffield who live in wardWalkley Ward27Dore & Totley Ward27Fulwood Ward23Broomhill & Sharrow Vale Ward23Nether Edge & Sharrow Ward22Ecclesall Ward21Gleadless Valley Ward18Stannington Ward16Burngreave Ward16City Ward15Crookes & Crosspool Ward14East Ecclesfield Ward14Manor Castle Ward13Stocksbridge & Upper Don Ward12Hillsborough Ward12Graves Park Ward10West Ecclesfield Ward9Beighton Ward9Darnall Ward9Birley Ward9Beauchief & Greenhill Ward9Mosborough Ward8Firth Park Ward8Woodhouse Ward6Richmond Ward5Southey Ward5Shiregreen & Brightside Ward4Park & Arbourthorne Ward4West Ward *Not in Sheffield1Hathersage and Eyam Ward *Not in Sheffield1Killamarsh West Ward *Not in Sheffield1Boston Castle Ward *Not in Sheffield1_Grand Total__372_
How does this vary across the political parties?
UKIP had 45% of candidates living in the ward where they’re standing (above the citywide average of 36%) but the Conservatives had only 26% of candidates living in the ward where they’re standing (below the citywide average of 36%).
Overall, Conservatives, TUSC and Liberal Democrats are below the citywide average, and Labour, Green and UKIP are above the citywide average. PartyLive in WardDon’t Live in Ward****CandidatesConservative and Unionist Party26%1474%3953Trade Unionist and Socialist Coalition26%674%1723Liberal Democrats33%2867%5684Labour37%3163%5384Green Party42%3558%4984UK Independence Party (UKIP)45%1955%2342Independent100%10%1Yorkshire First100%10%1_Grand Total__36%__135__64%_237__372
A map for every ward
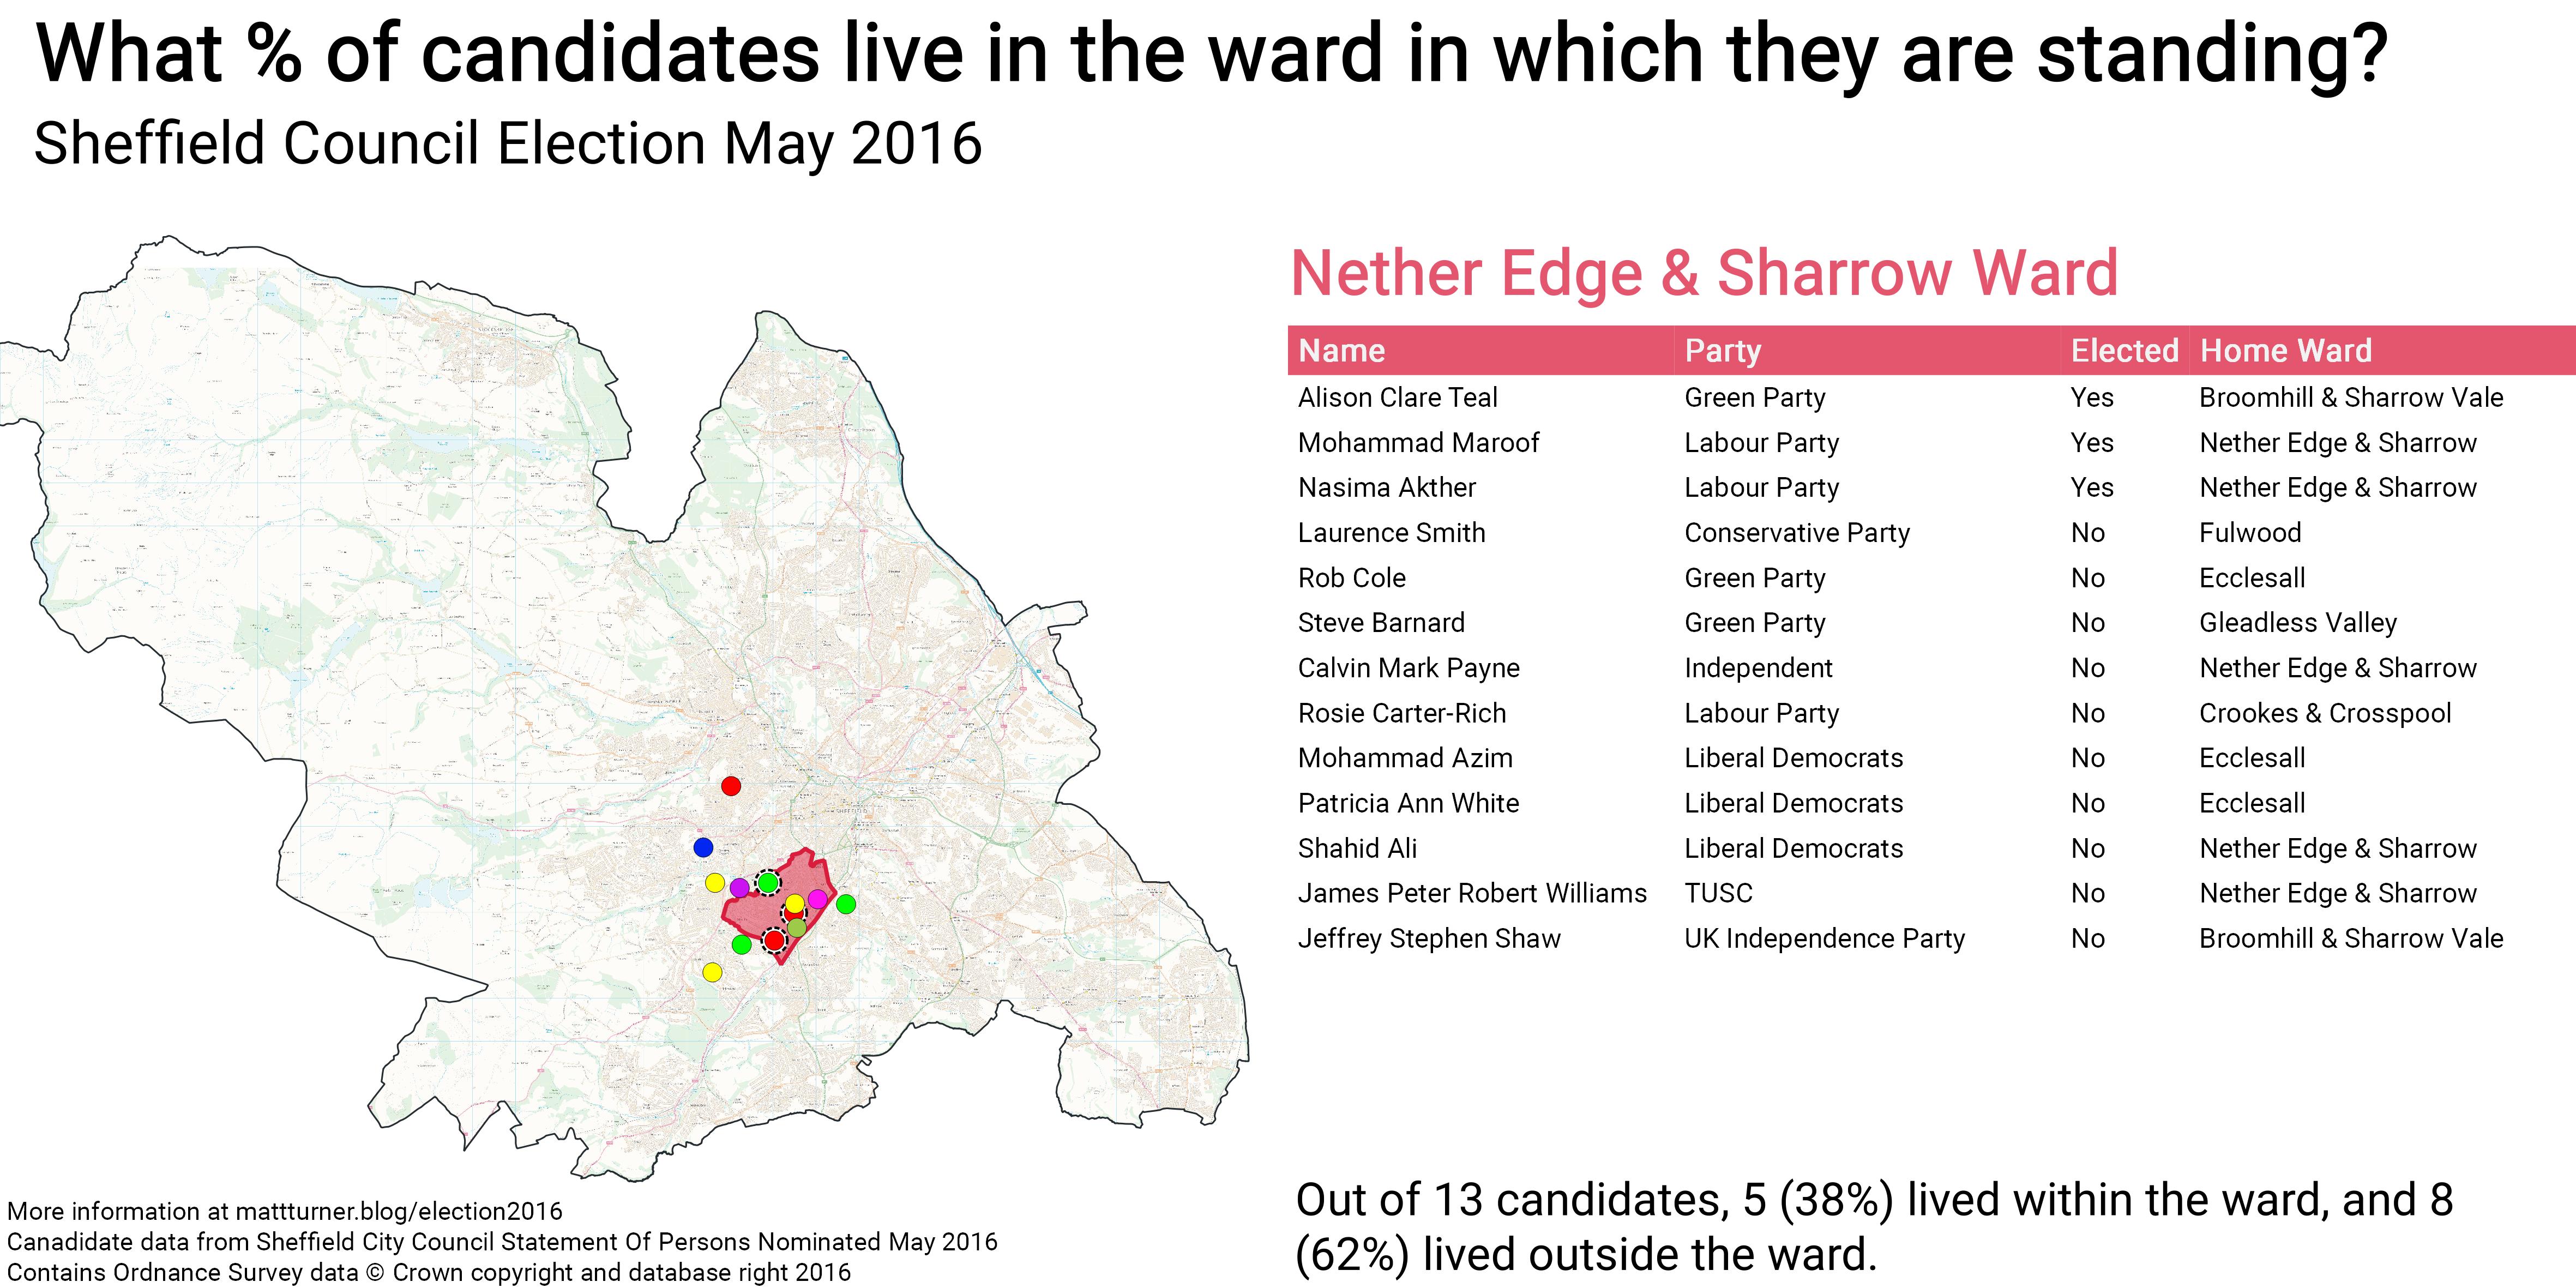
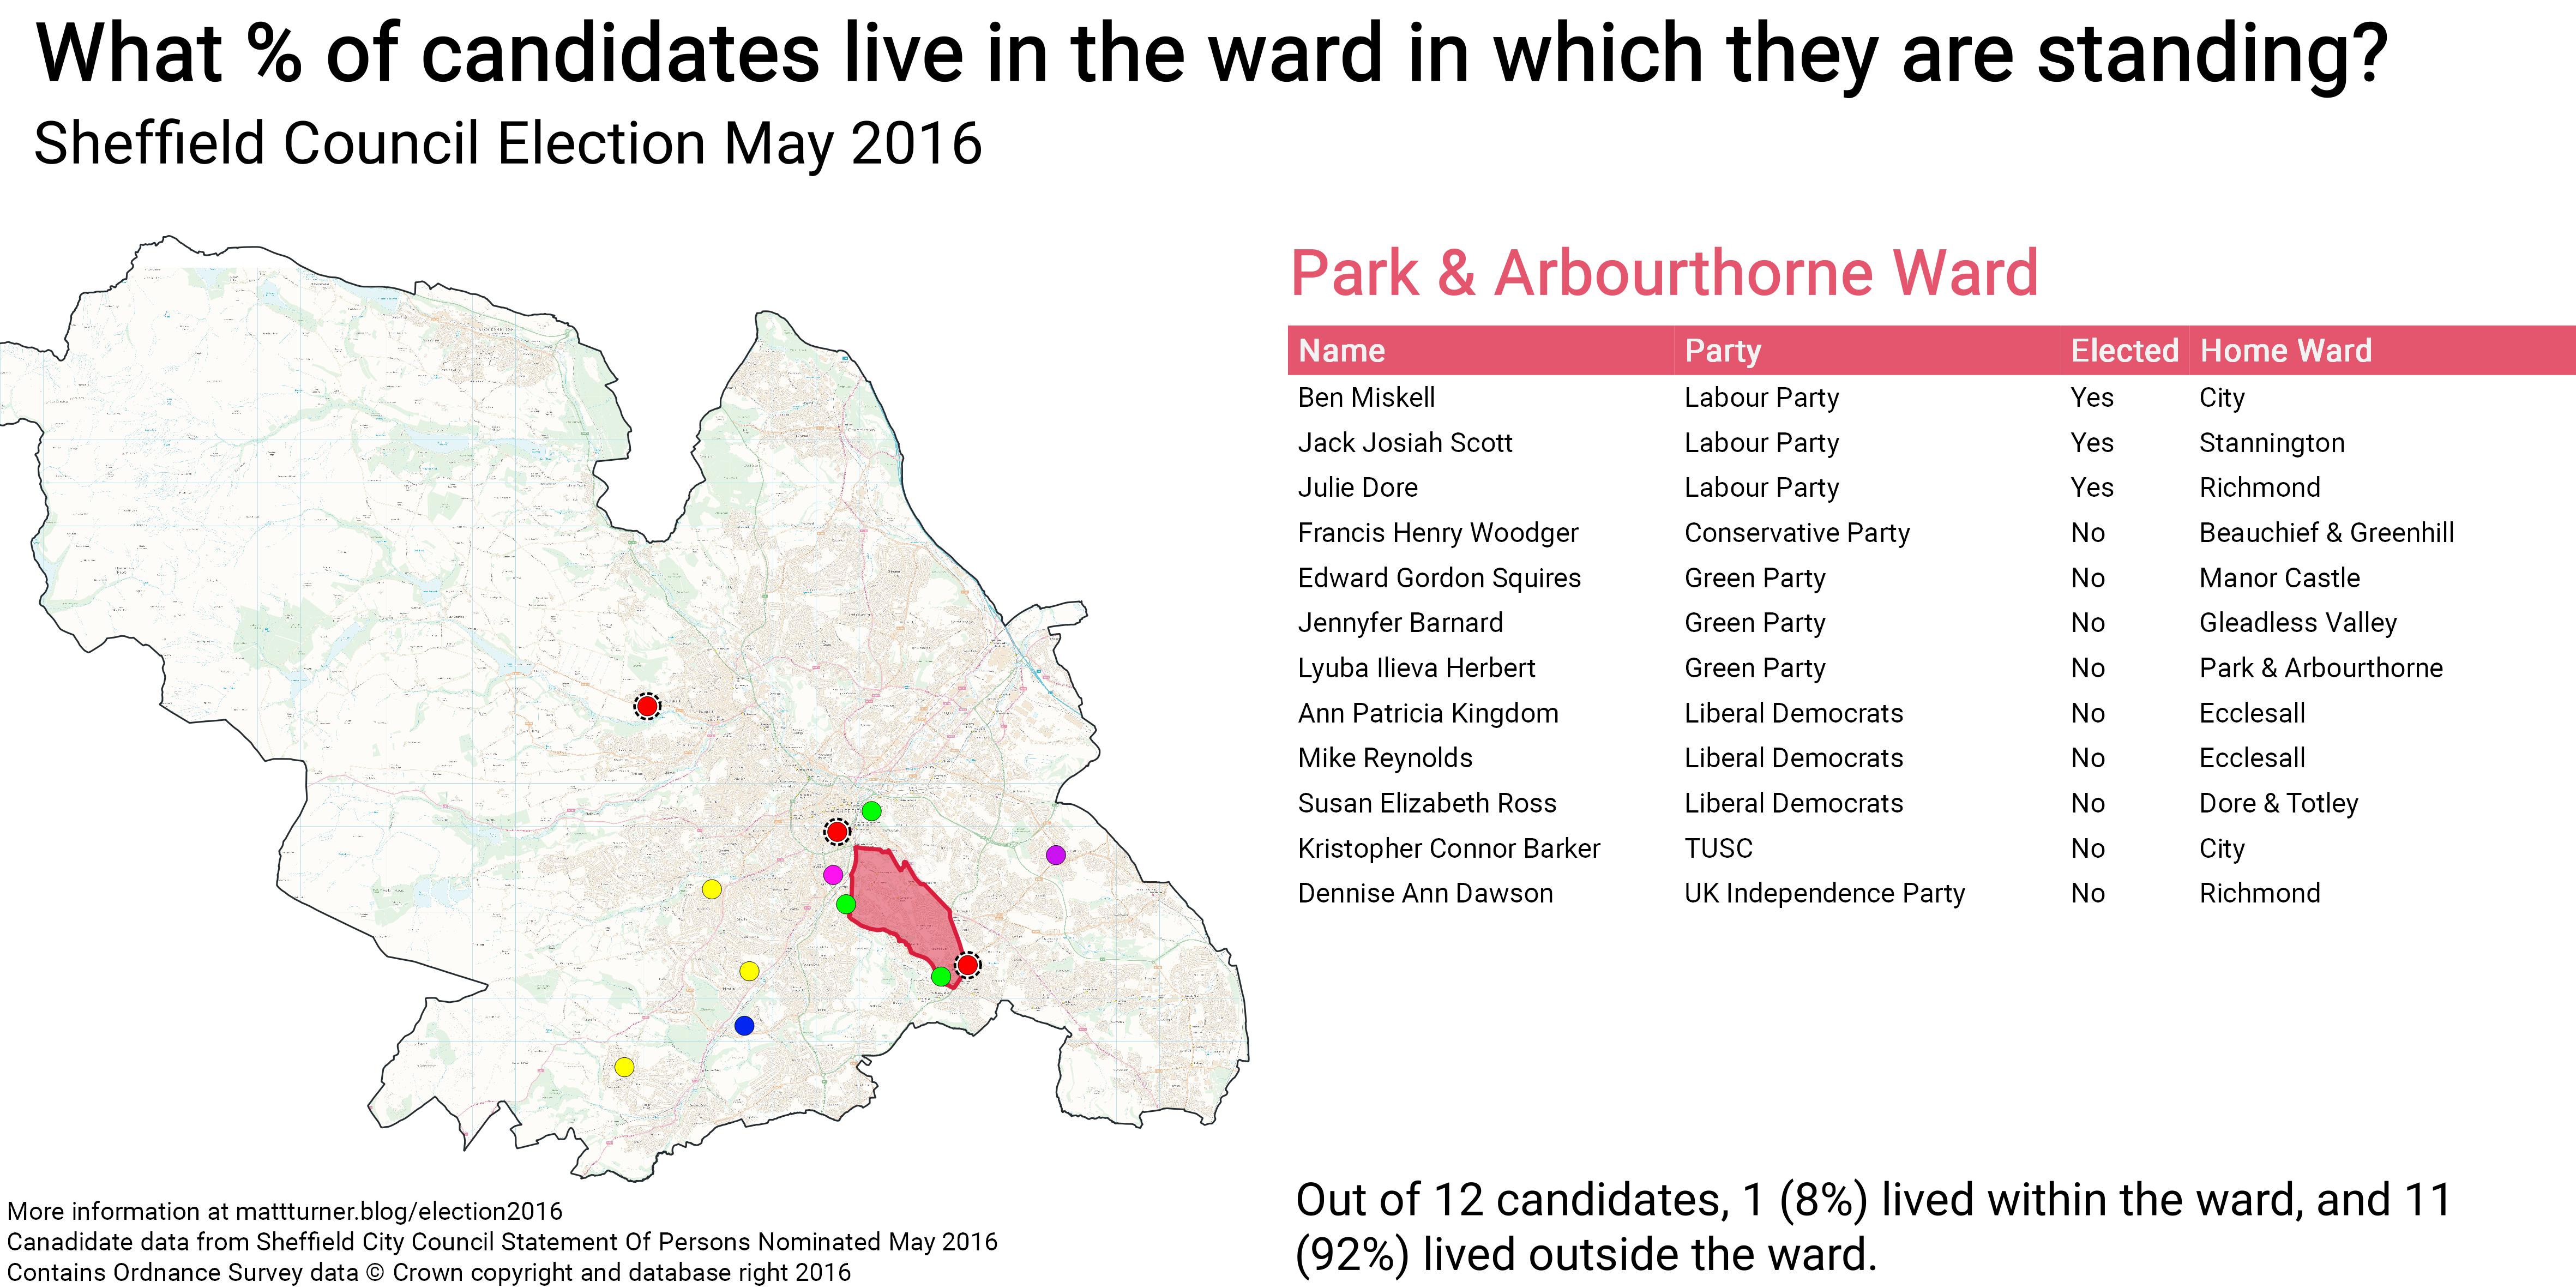
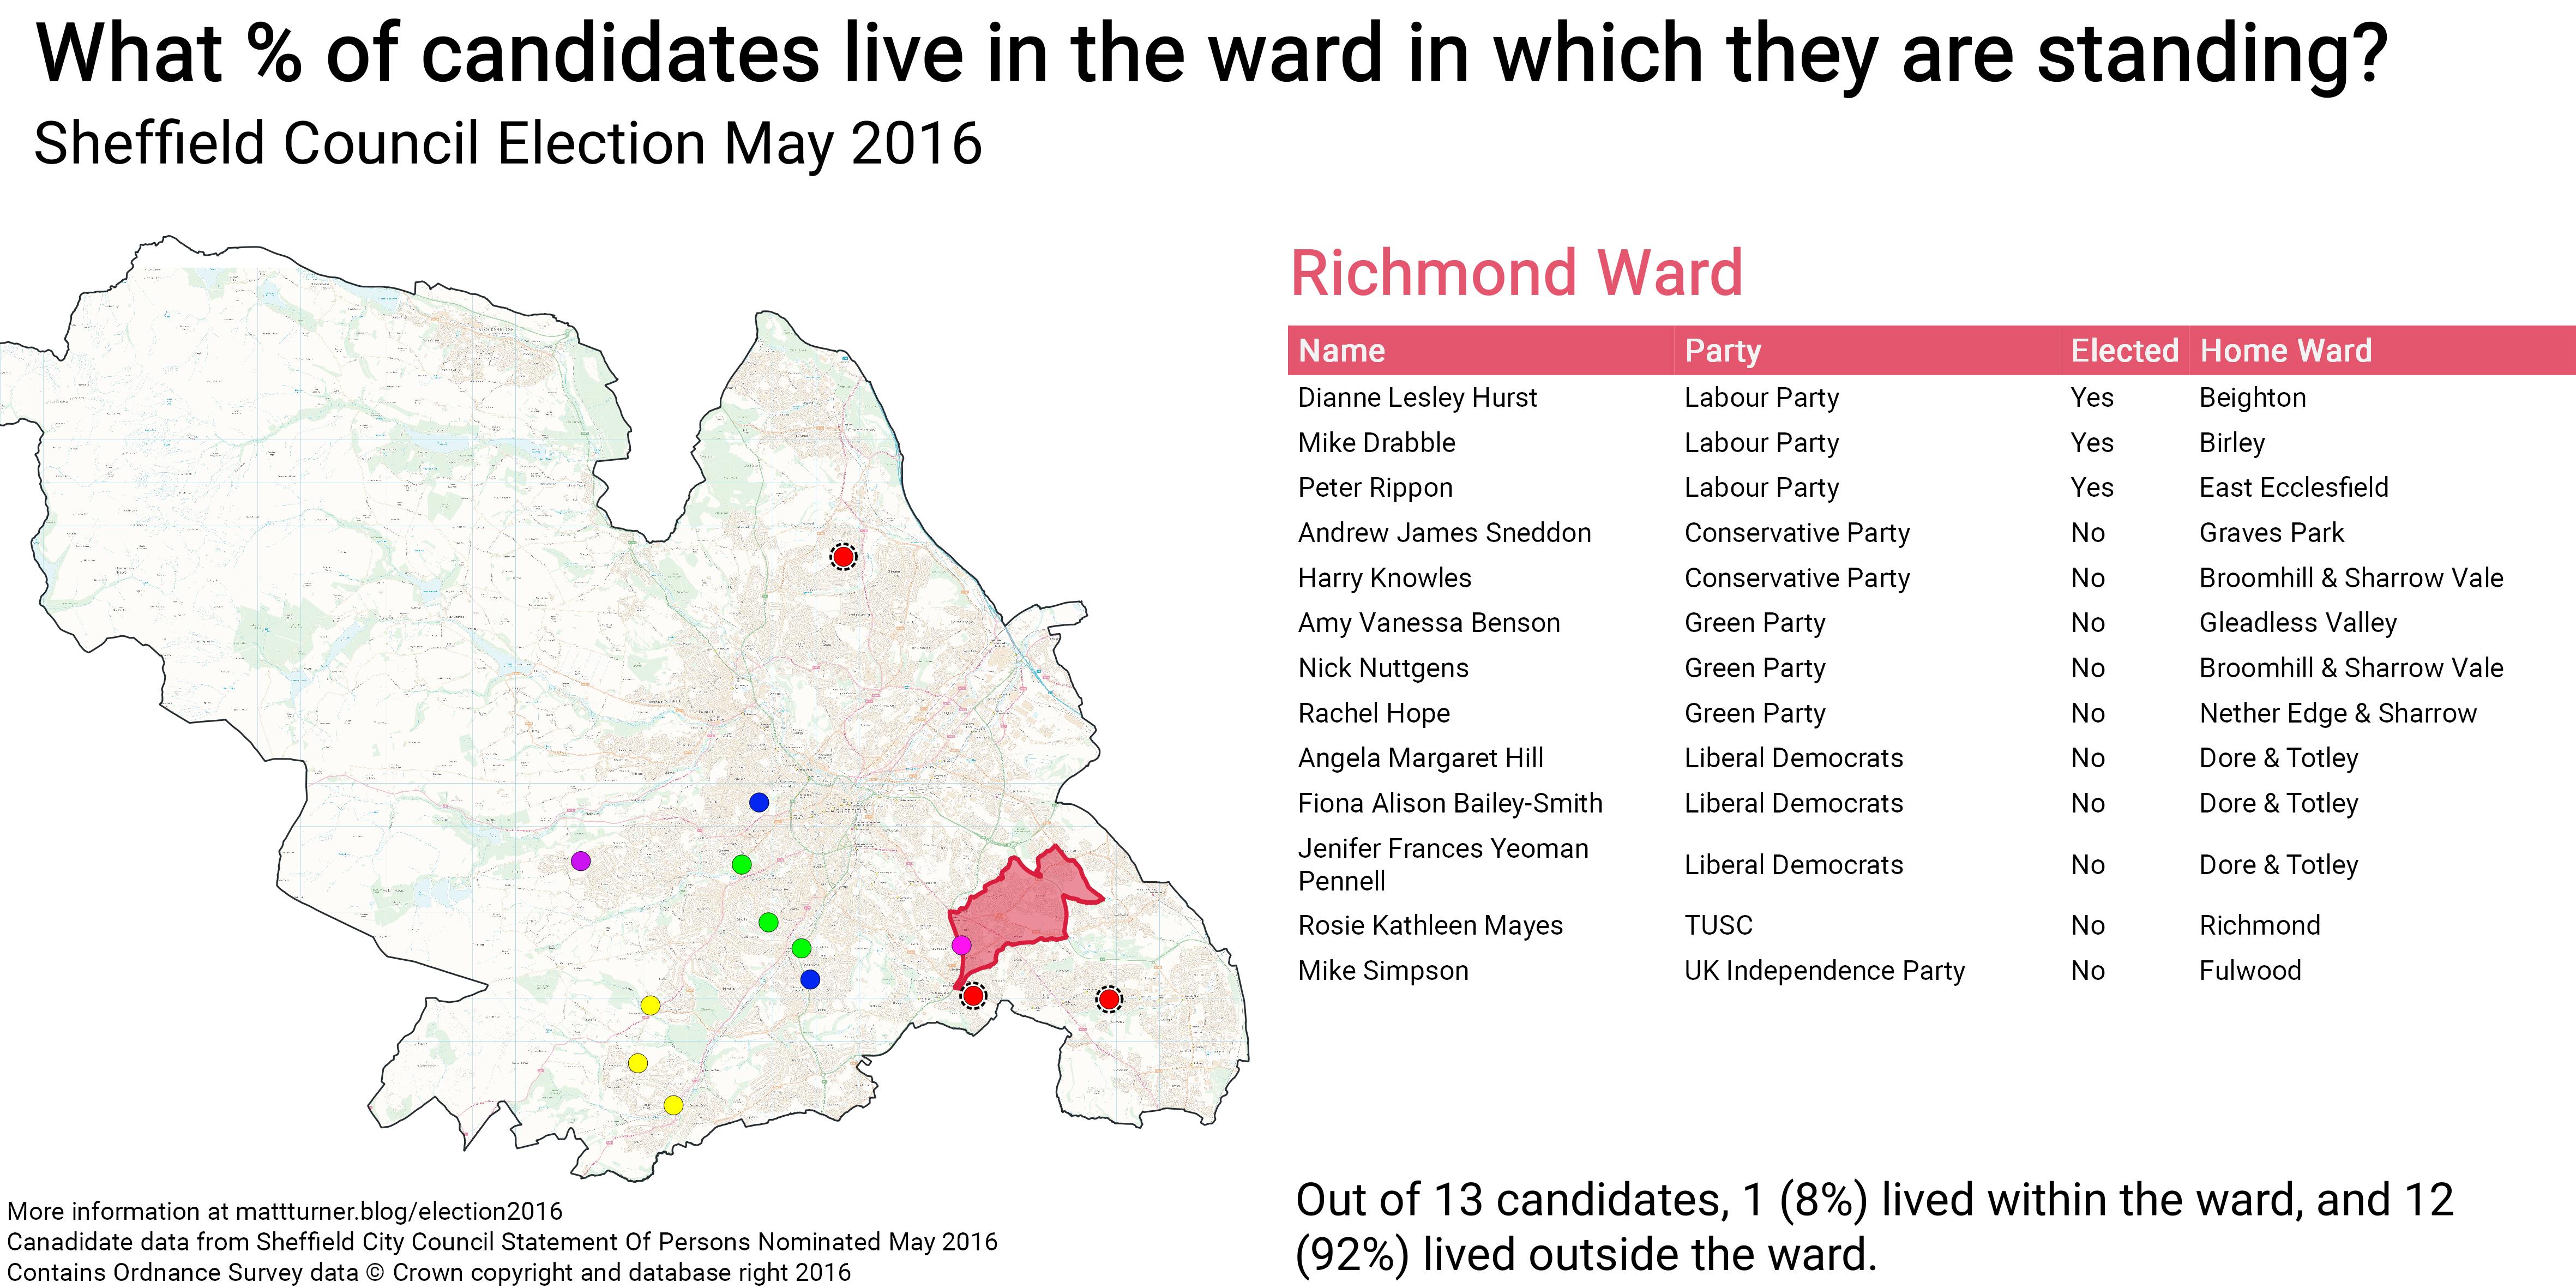
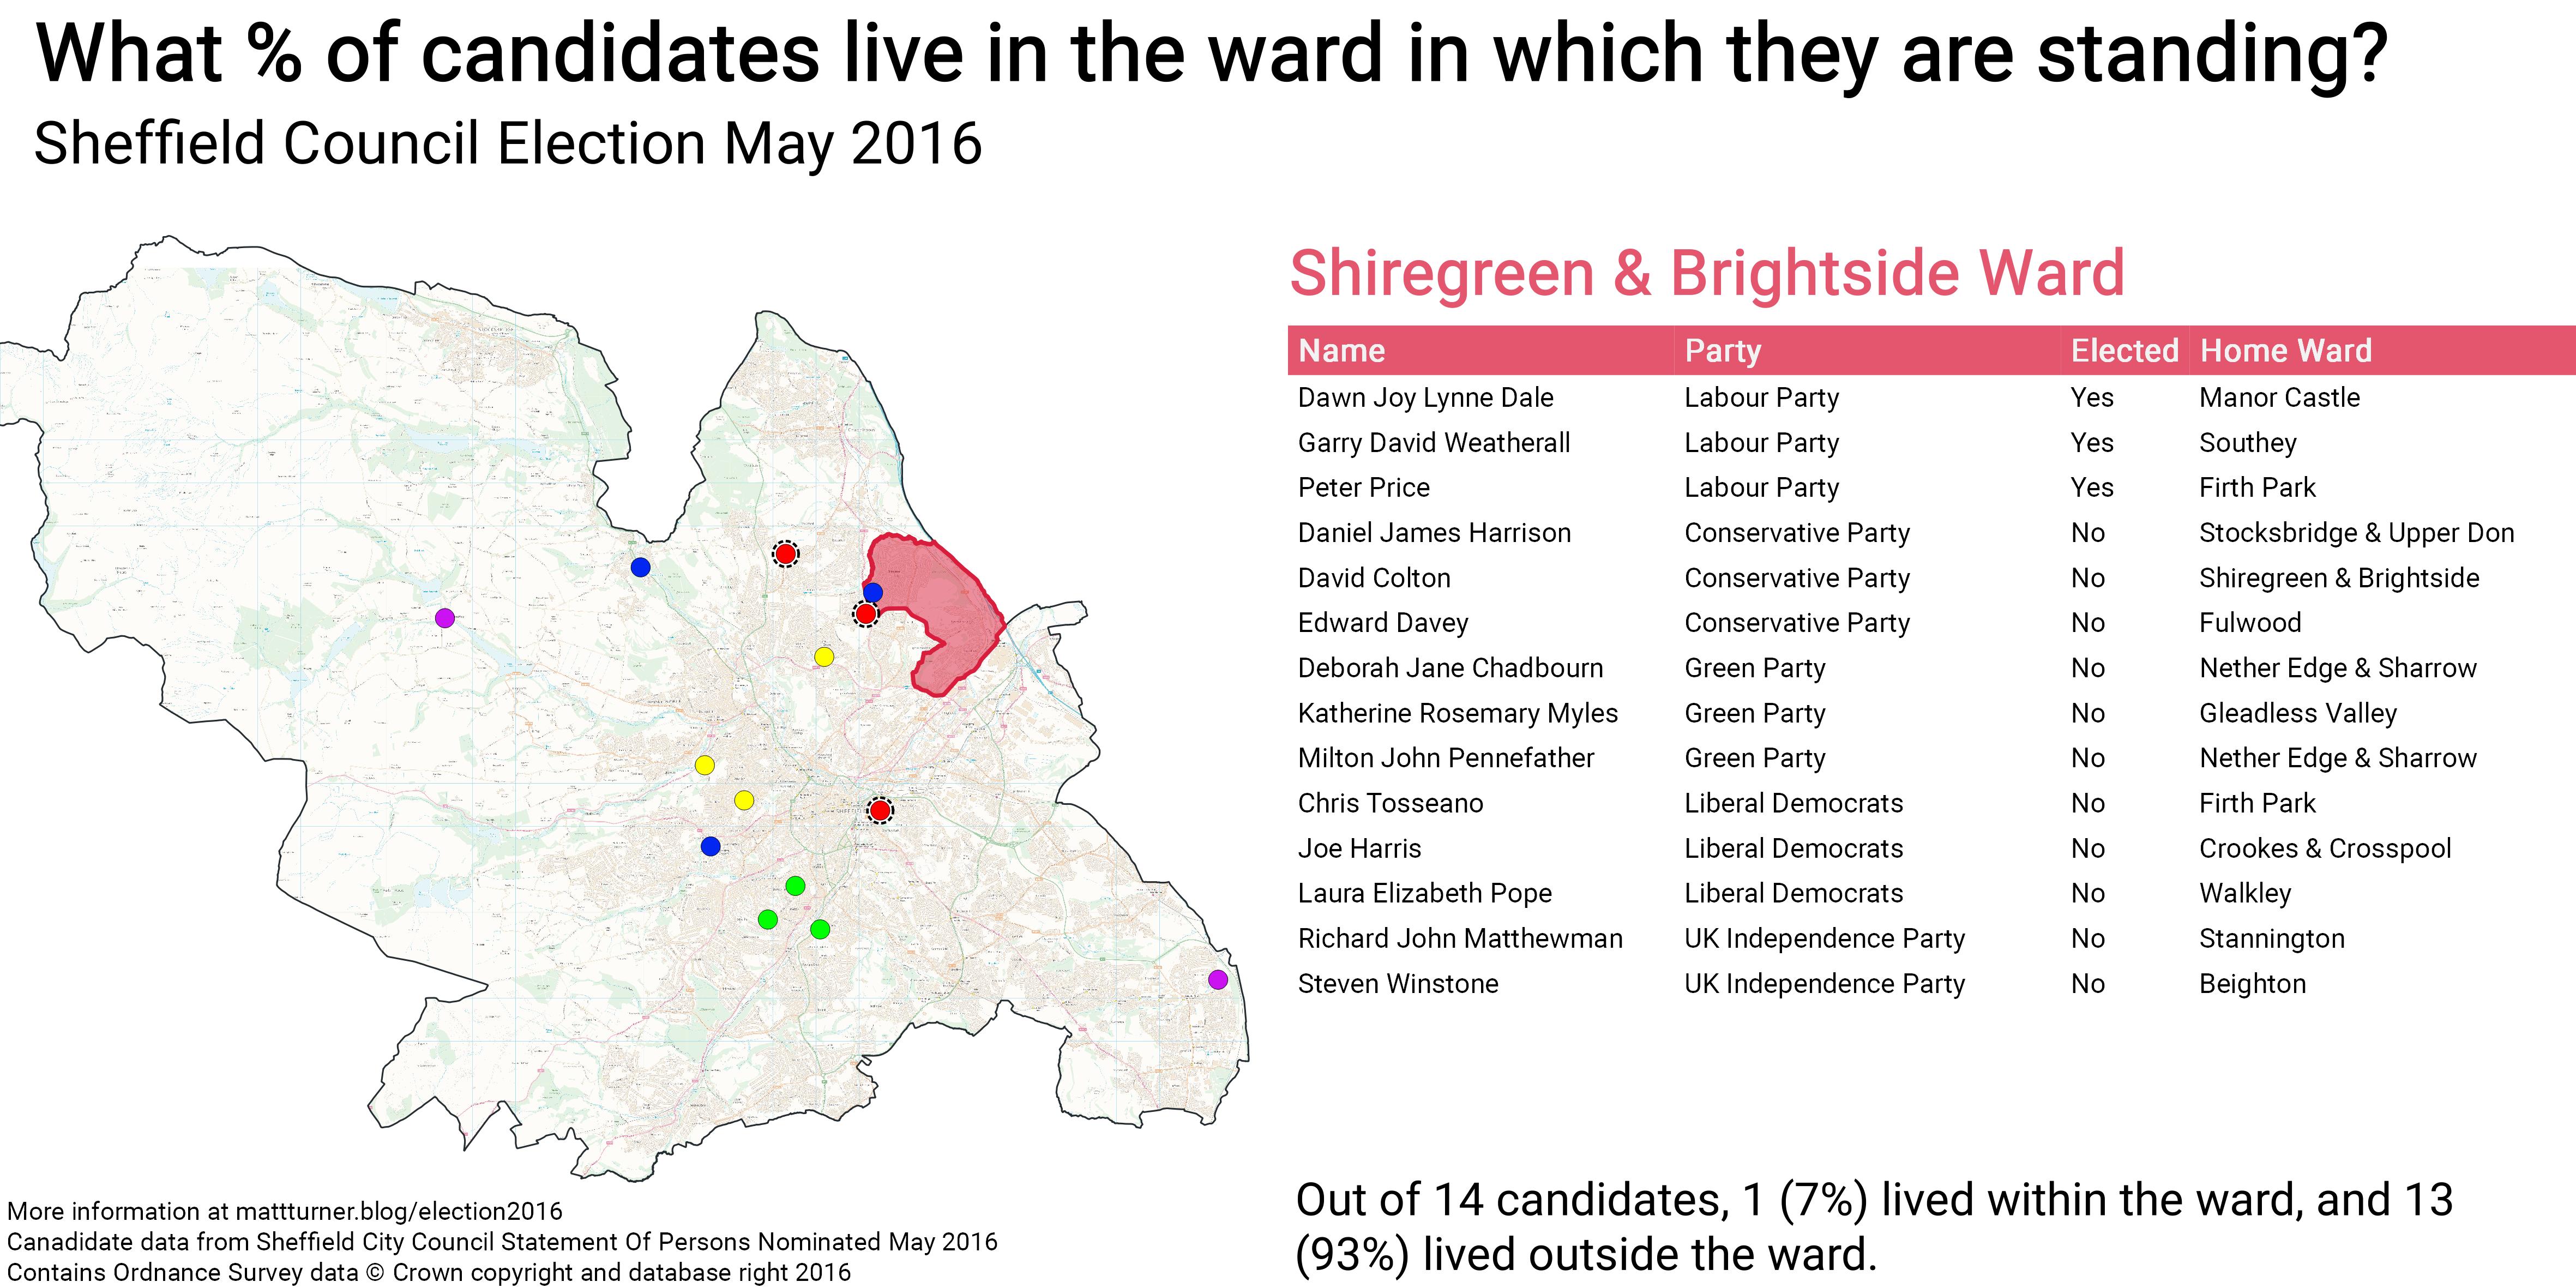
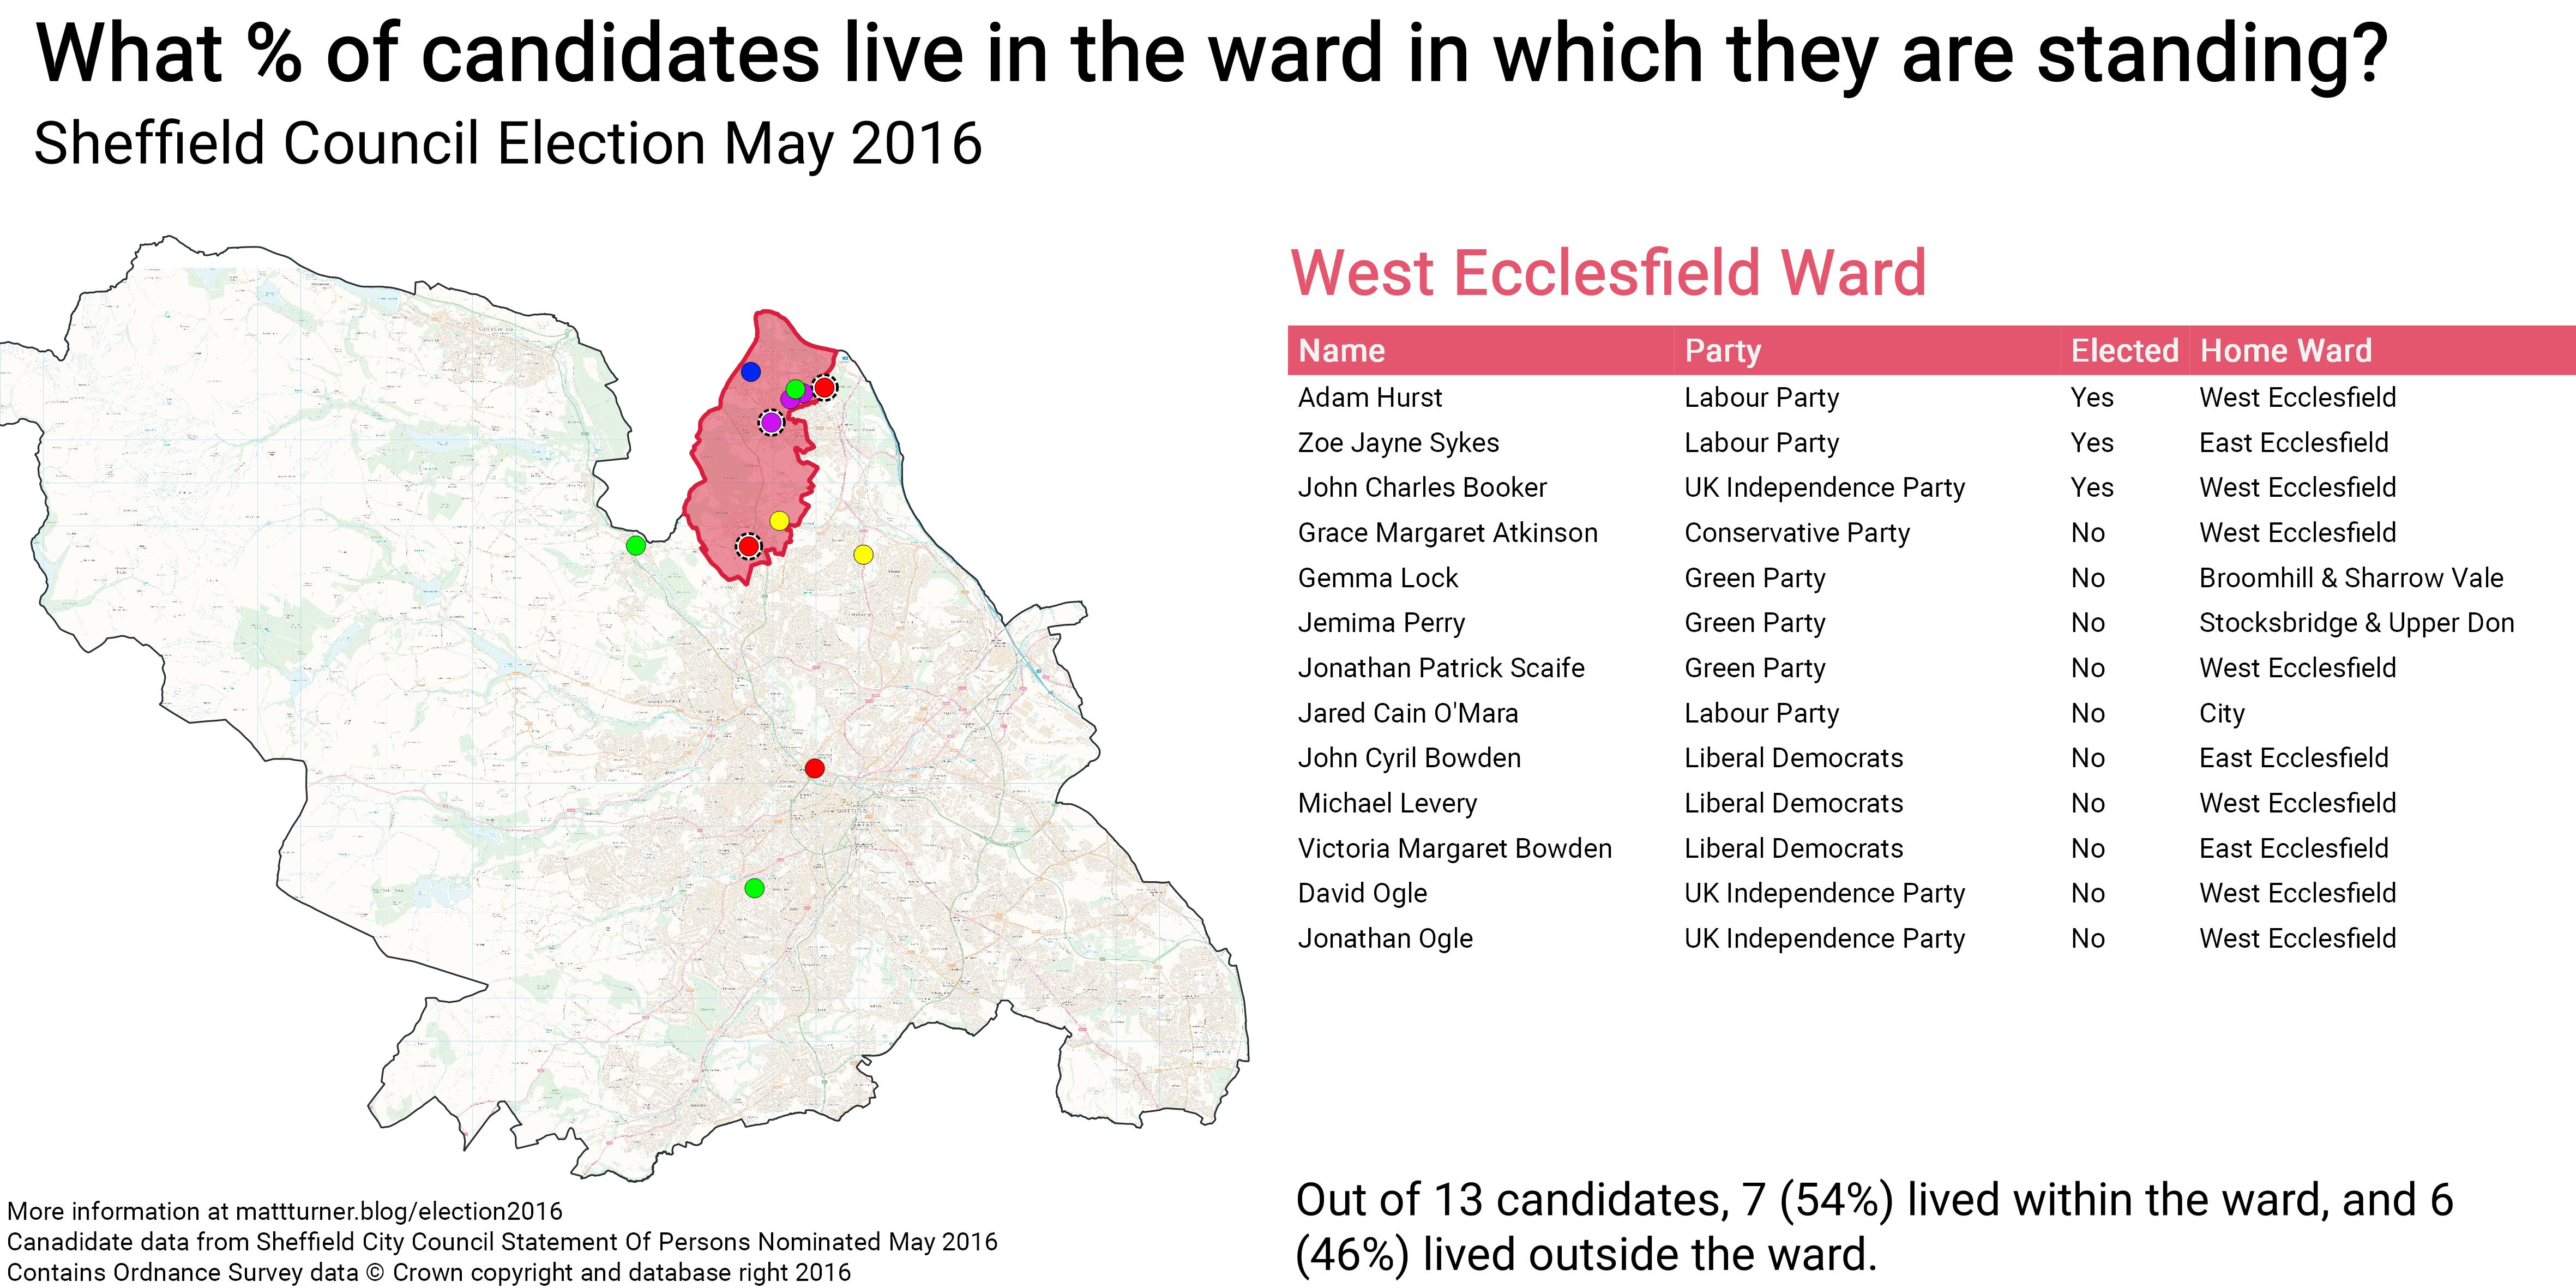
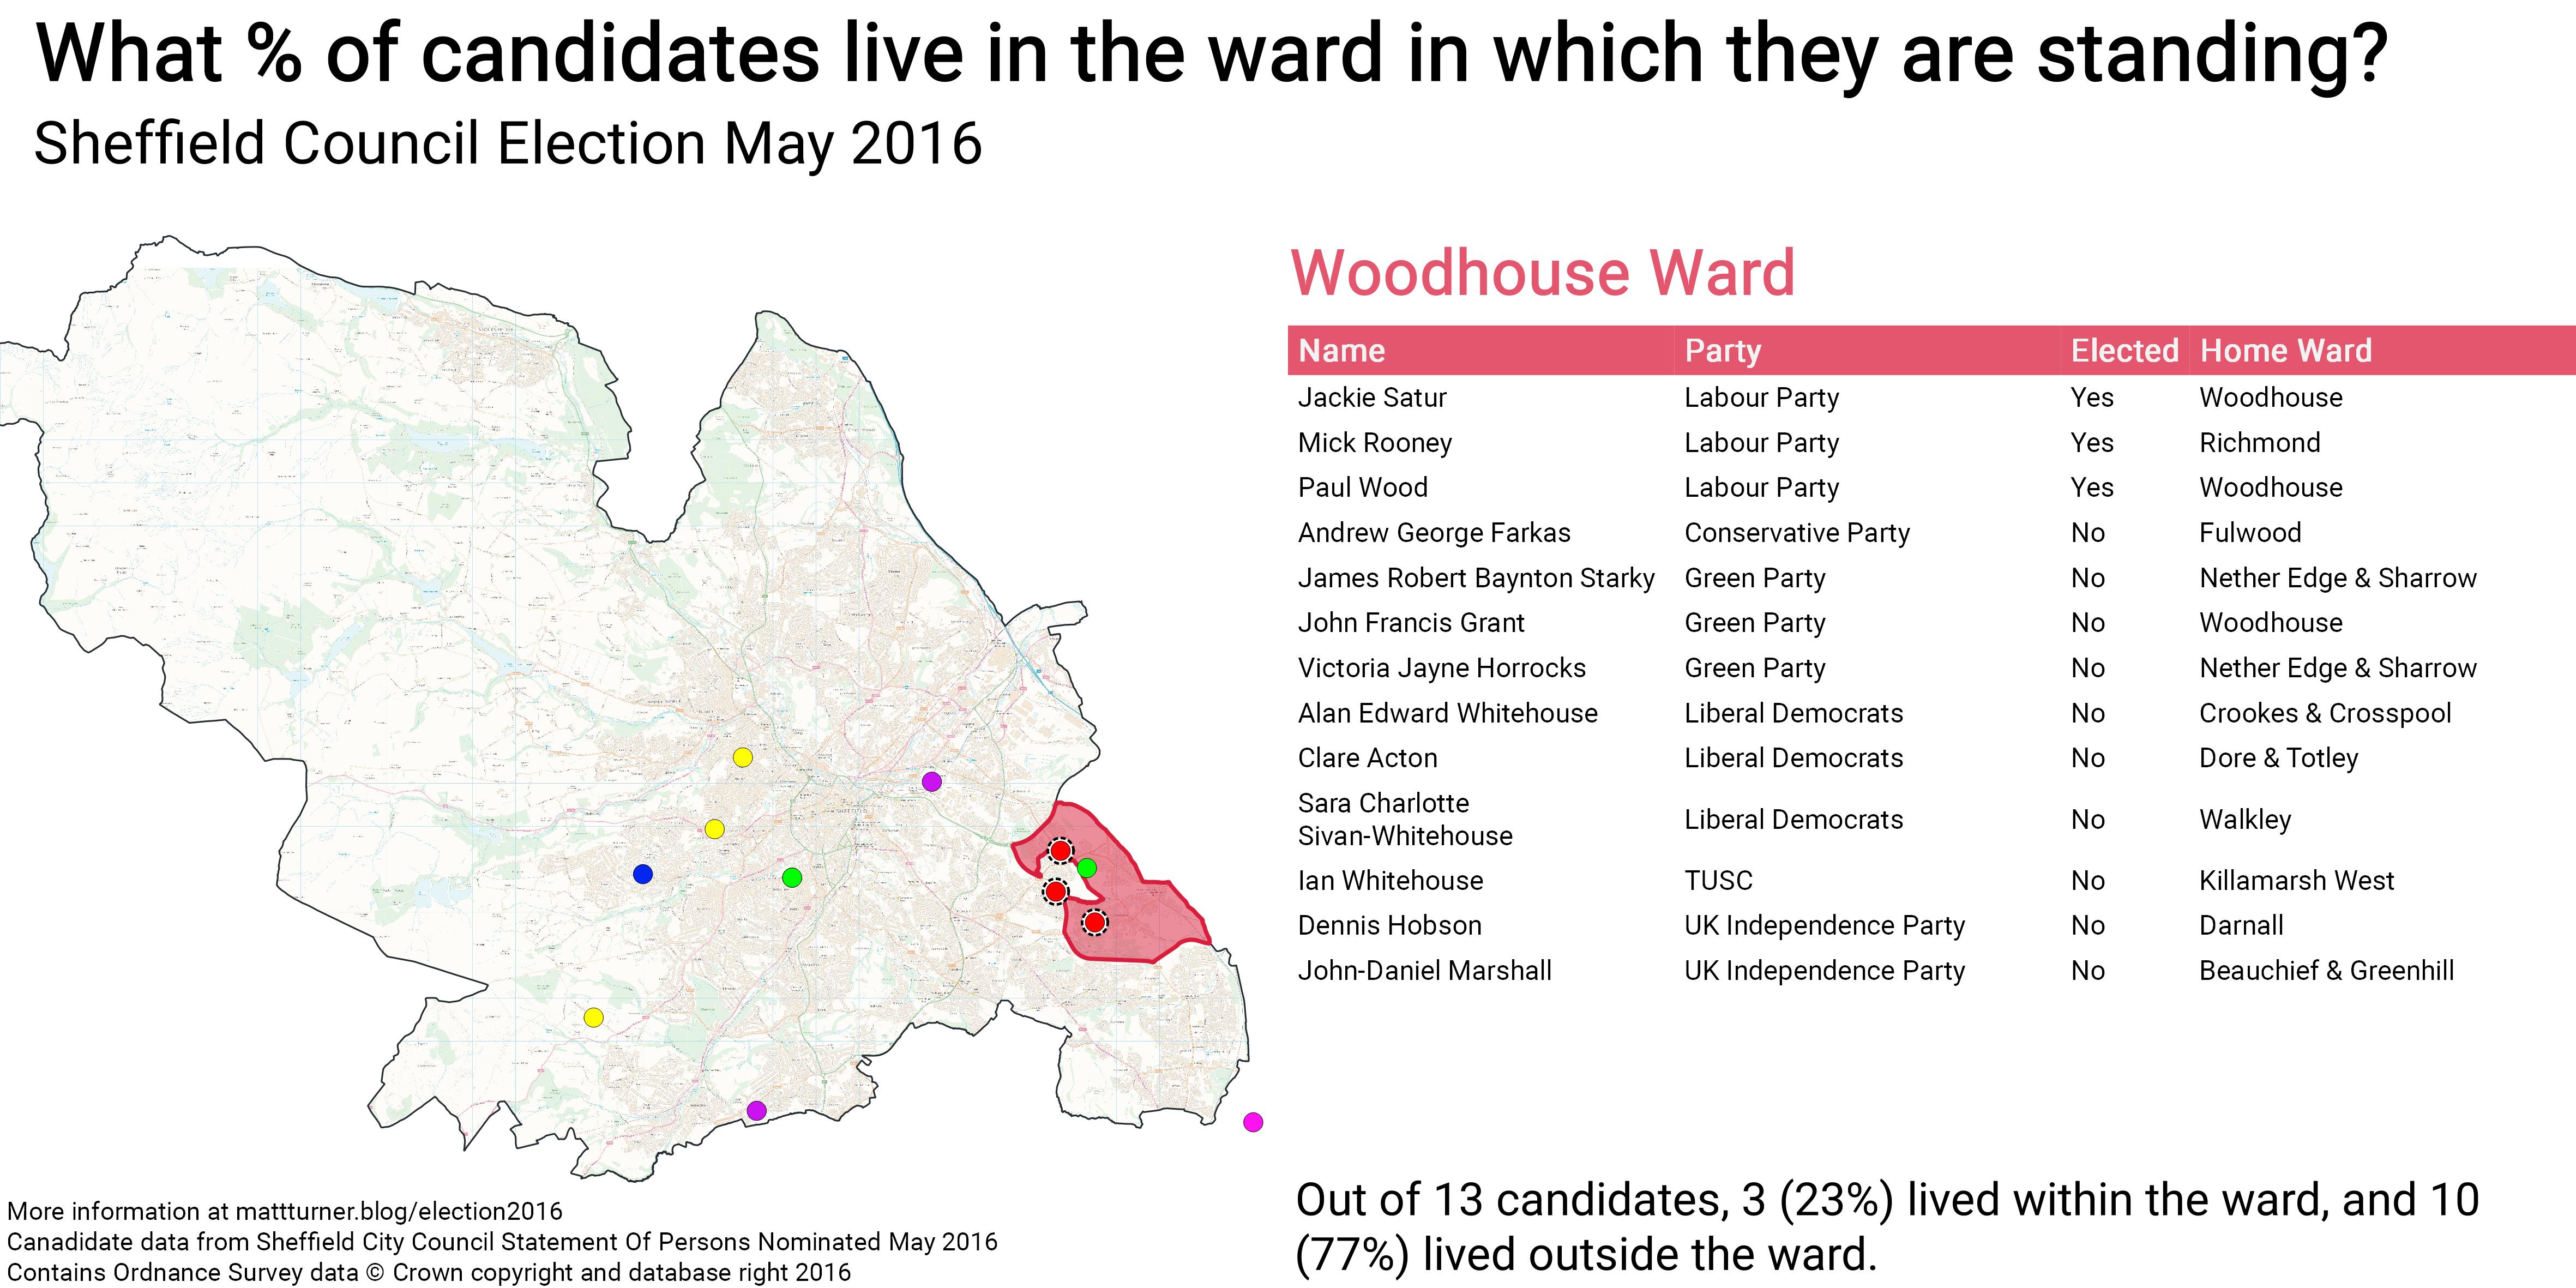
 jgh
jgh